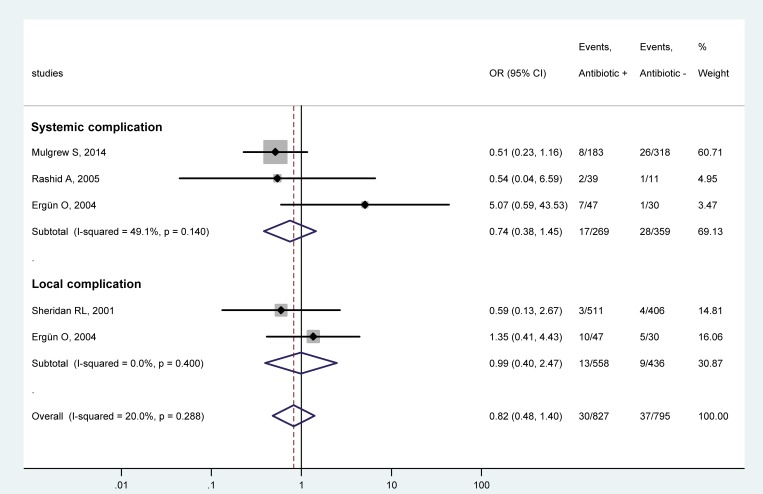
Fig 2. Forest plot of the odds ratios (ORs) for systemic and local subgroups of infectious complications in pediatric patients with burn injuries who received systemic antibiotic prophylaxis compared to those who did not.
Here, and in Figs 3–5, black circles represent the OR for each study, while the left and right horizontal arms of the circles indicate the corresponding 95% confidence intervals (CI) for the OR. The size of the gray box is proportional to the sample size of the study; bigger box represents larger sample size, thus bigger relative weight of the study, and vice versa. The diamonds represent the average OR calculated from the ORs of the individual studies in a subgroup (top and middle) and in all studies (bottom). The left and right vertices of the diamonds represent the 95% CI of the average ORs. The vertical dashed line is determined by the low and top vertices of the bottom diamond and indicates the value of the average OR of all studies in the forest plot. An OR lesser than 1 indicates that the use of systemic antibiotic prophylaxis decreased the chance for infectious complications, whereas an OR higher than 1 indicates an increased chance for infections in the antibiotic-treated children.

