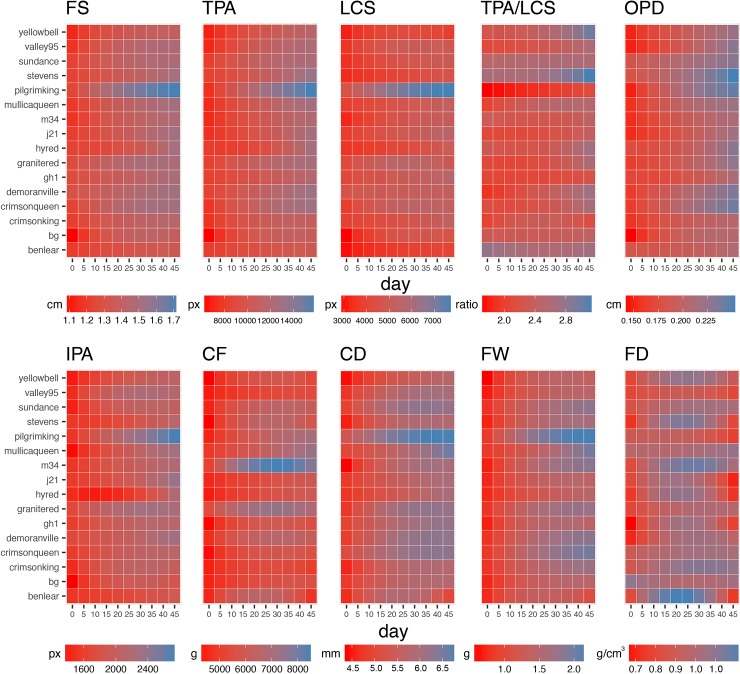
Fig 3. Changes in fruit structure and firmness attributes during the ripening process at cultivar level.
Heatmaps for fruit size (FS), total pericarp area (TPA), locule size (LCS), total pericarp area-to-locule size (TPA/LCS), outer pericarp diameter (OPD), internal pericarp area (IPA), compression force (CF), compression distance (CD), fruit weight (FW), and fruit density (FD) are colored according with fitted values obtained from a quadratic model evaluated every 7 days during 10 time points.

