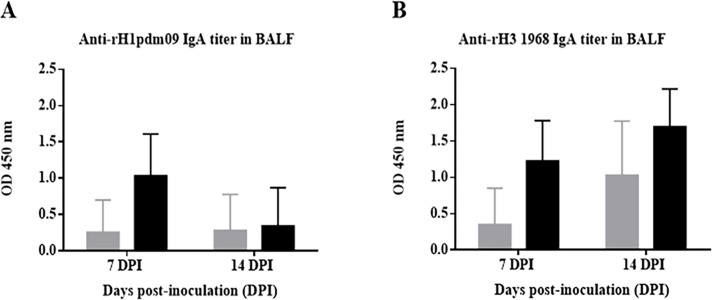
Fig 4. Antibody HA-specific IgA titers detected in BALFs samples from Experiment II.
Mean of BALFs IgA antibody levels detected in pigs sacrificed at 7 and 14 dpi of Groups A and B (A) against HA from A/California/04/09(H1N1)pdm09, and (B) against HA from A/Aichi/2/1968(H3N2). Grey bars refer to group A (unvaccinated group), and black bars refer to group B (pCDNA3.1(+)-VC4-flagellin vaccinated group). OD, optical density. PVD, post-vaccination days and DPI, days post-inoculation. Error bars indicate the mean ± SEM.

