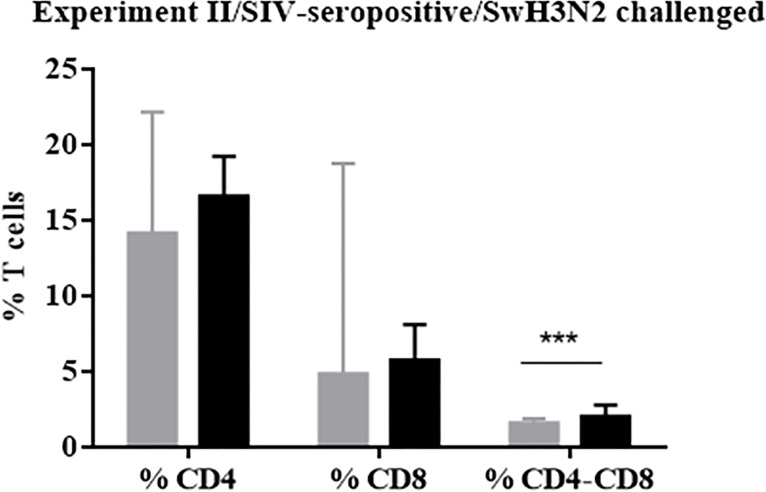
Fig 6. Flow cytometry from PBMCs isolated at 35 PVD (Experiment II).
Mean of the percentages of T cells CD4, CD8 and CD4-CD8 DP from unvaccinated (Group A) and vaccinated (Group B). Grey bars refer to group A (unvaccinated group) and black bars depict group B (pCDNA3.1(+)-VC-4-flagellin vaccinated group). Error bars indicate the mean ± SEM and statistically significant differences between vaccine treatment groups are marked with ***: P<0.001.

