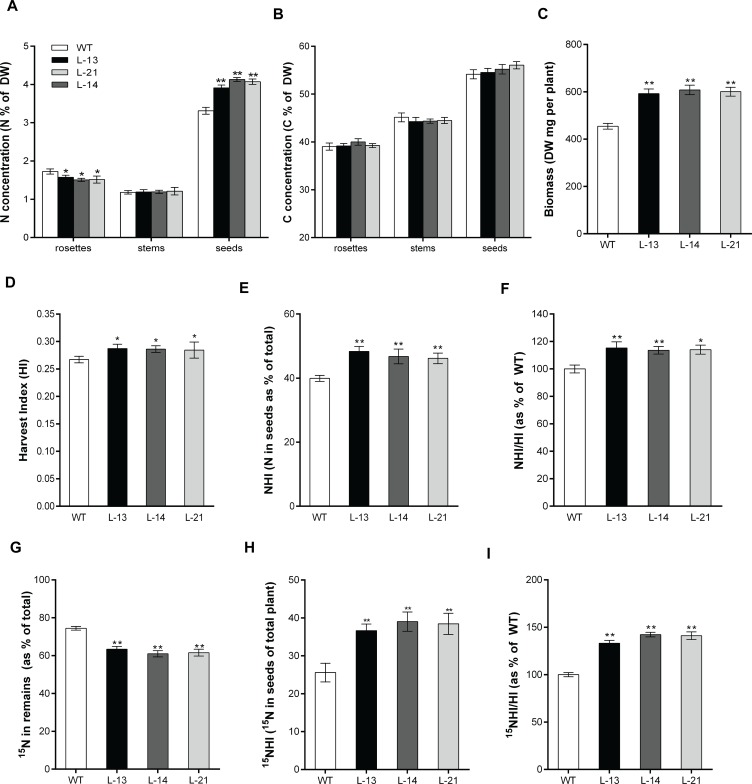
Fig 6. Evaluation of NUE and NRE in transgenic Arabidopsis.
(A) N concentration (N%, presented as mg per 100 mg DW) and (B) C concentration (C%, presented as mg per 100 mg DW) of the transgenic lines and WT were measured in rosettes, stems and seeds after harvesting. (C) Biomass accumulation as measured by dry weight of the whole plant. (D) HI was measured as the ratio of the dry weight of total seeds to the dry weight of remains. (E) NHI was measured as the partitioning total N in seeds. (F) NHI/HI ration was calculated as a percentage of WT and used to estimate NUE between the transgenic lines and WT. (G) Partitioning of 15N in remains of the transgenic lines and WT after harvesting. (H) 15NHI was measured as the partitioning total 15N in seeds. (I) 15NHI/HI ration was calculated as a percentage of WT and used to estimate NRE between the transgenic lines and WT. Values are means ± SD of three biological replicates (n = 12), *P < 0.05, **P < 0.01 (t-test).

