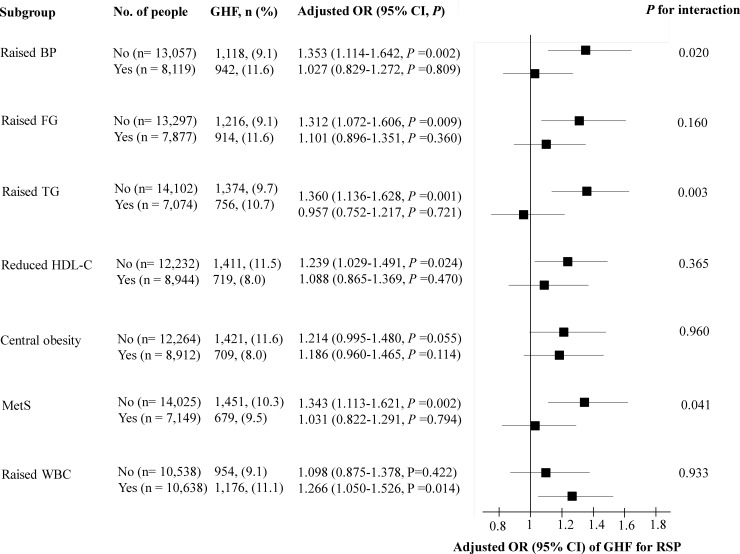
Fig 4. Subgroup analysis for the relationship between eGFR group and RSP.
RSP, respiratory spirometry pattern; eGFR, estimated glomerular filtration rate; OR, odds ratio; CI, confidence interval; BP, blood pressure; FG, fasting glucose; TG, triglyceride; HDL-C, high density lipoprotein cholesterol; MetS, metabolic syndrome; WBC, white blood cells. Adjusted OR and 95% CI were analyzed using multivariate logistic regression analysis, entering into variables in Table 2 as covariates. Raised WBC was defined as above median of WBC levels (≥5820/μl). When covariates were chosen as subgroup, they were excluded from the model.

