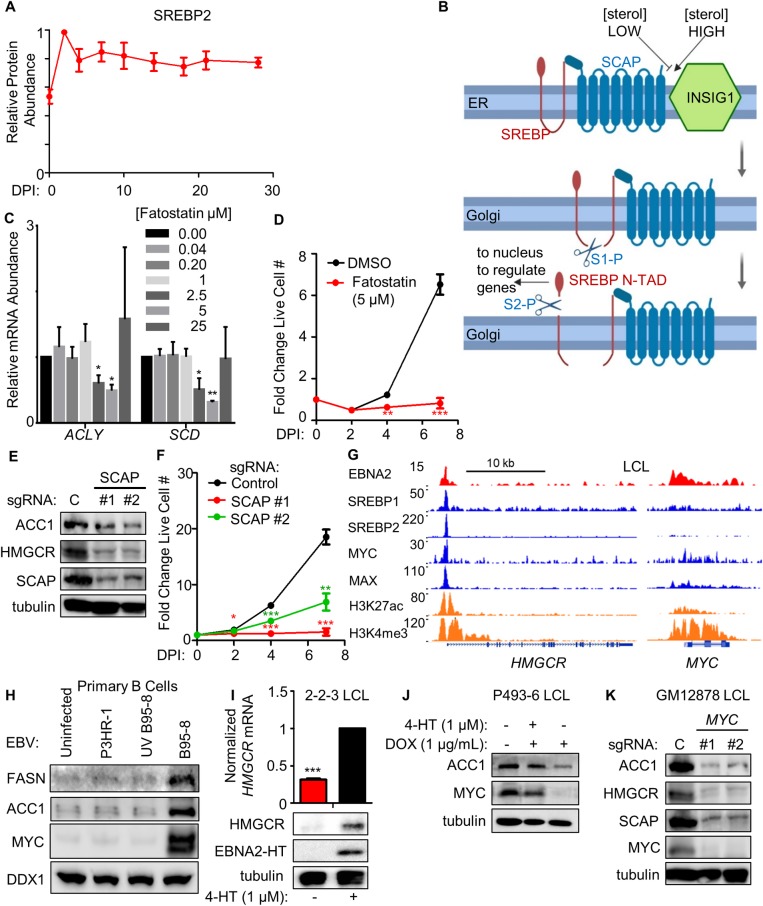
Fig 2. EBNA2, MYC and SREBPs induce key lipid biosynthesis enzymes.
(A) Temporal profile of SREBP2 protein abundance over the indicated days post-infection (DPI) of primary human B cells. Data show the mean + SEM from three biological replicates, n = 3. (B) Schematic showing SREBP regulation by sterol levels. Under sterol-sufficient conditions, SCAP binds to INSIG1 to promote SREBP ER retention. When sterol levels are insufficient, SCAP dissociates from INSIG1 and chaperones SREBPs to the Golgi apparatus, where site-1 and site-2 proteases (S1-P and S2-P, respectively) cleave SREBPs. Transcriptionally active N-terminal SREBP domains (denoted as ‘N-TAD’) re-localize to the nucleus to transactivate cholesterogenic and lipogenic target genes. (C) Quantitative RT-PCR analysis of SREBP target gene ACLY and SCD mRNA abundances in primary human B-cells infected by B95-8 EBV which were cultured in the presence of DMSO or the indicated SREBP/SCAP inhibitor fatostatin doses for days 2–7. Data show the mean + SEM fold change values for n = 3 replicates, *, p<0.05, **, p<0.01 (two-tailed t-test). (D) Growth curve analysis of newly infected primary human B-cells cultured in the presence of DMSO or fatostatin at 5 μM from days 2–7. Data show the mean + SEM fold change values relative to day 0, n = 3. **, p<0.01; ***, p<0.005 (two-tailed t-test). See also S3D Fig. (E) Immunoblot analysis of ACC1, HMGCR, SCAP and tubulin levels in WCL prepared from Cas9+ GM12878 LCL expressing the indicated non-targeting control (C) or independent SCAP targeting sgRNAs. Representative blots of n = 3 replicates are shown. (F) Growth curve analysis of Cas9+ GM12878 LCL that express either control or independent SCAP-targeting sgRNAs. Mean + SEM fold change values relative to day 0 levels are shown for n = 3 replicates. *, p<0.05; **, p<0.01; ***, p<0.005 (two-tailed t-test). (G) Chromatin immunoprecipitation (ChIP)-sequencing (ChIP-seq) tracks for the indicated transcription factors or histone epigenetic marks histone 3 lysine 27 acetyl (H3K27Ac) or histone 3 lysine 4 trimethyl (H3K4Me3) at the LCL HMGCR locus. Shown to the right for comparison are tracks for the well characterized EBNA2 target MYC as a positive control. Y-axis ranges are indicated for each track. (H) Immunoblot analysis for the indicated B-cell proteins using WCL obtained from primary cells that were either mock-infected or infected with equal amounts of the non-transforming P3HR-1, UV-irradiated B95-8 or B95-8 EBV strains for four days. Representative blots of n = 2 replicates are shown. See also S3F Fig. (I) Quantitative PCR analysis and immunoblot analysis of samples prepared from EBNA2-HT LCLs grown in the absence (EBNA2 non-permissive) or presence (EBNA2 permissive) of 4HT (1 μM) for 48 hours. Quantitative PCR data show the mean + SEM from n = 3 replicates. ***, p<0.005 (one-sample t-test). Representative blots (n = 3) are shown. (J) Immunoblot analysis of WCL prepared from conditional P493-6 LCLs treated with doxycycline (DOX) to suppress exogenous MYC allele expression and/or with 4HT to induce EBNA2 activity for 48 hours, as indicated. Representative blots (n = 3) are shown. (K) Immunoblot analysis of WCL prepared from Cas9+ GM12878 LCL expressing control (C) or independent MYC-targeting sgRNAs, as indicated. Representative blots from n = 3 experiments are shown.

