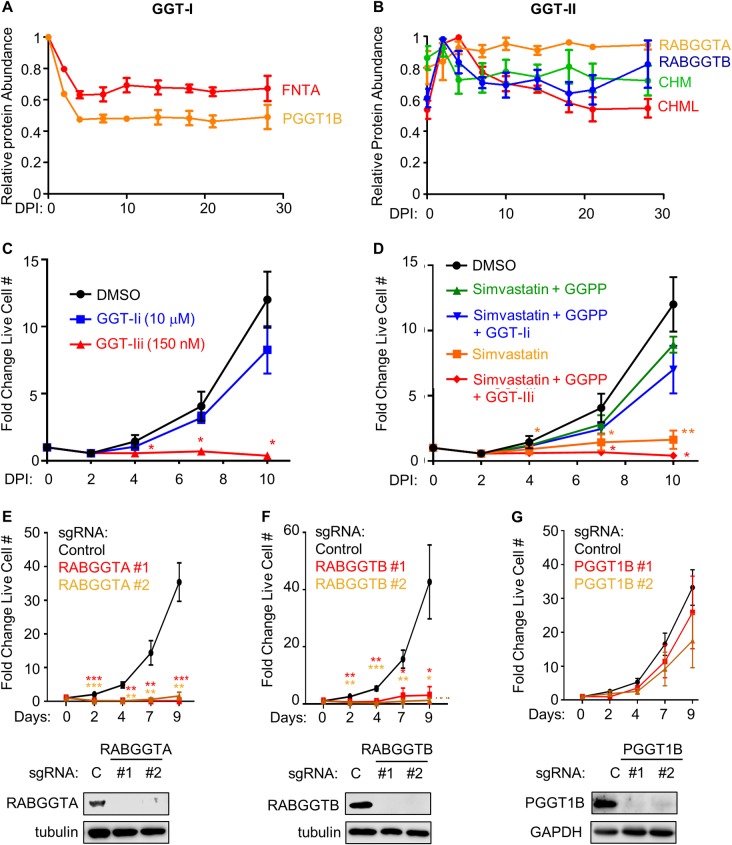
Fig 4. EBV induced GGT-II and its substrate GGPP are critical for EBV-infected primary human B-cell outgrowth.
(A) Temporal traces of relative protein abundances for the GGT-I subunits FNTA and PGGT1B. Mean + SEM levels for three biological replicates are shown. (B) Temporal traces of relative protein abundances for GGT-II subunits RABGGTA, RABGGTB, CHM and CHML. Mean + SEM levels for three biological replicates are shown. (C) Growth curve analysis of newly infected primary B-cells cultured in the presence of DMSO, GGTI-2133 (GGT-Ii, 10 μM) or BMS-214662 (GGT-IIi, 150 nM) from 2–10 DPI. Inhibitors were refreshed at each timepoint. Mean + SEM fold change live cell numbers from n = 3 replicates are shown. *, p<0.05 (two-tailed t-test). (D) Chemical epistasis-growth curve experiments with newly infected primary B-cells treated as indicated. Cells were cultured with DMSO, simvastatin (2 μM), GGPP (2 μM), the GGT-I inhibitor GGTI-2133 at 10 μM (GGT-Ii) or the GGT-II inhibitor BMS-214662 at 150 nM (GGT-IIi) from 2–10 DPI. Simvastatin and GGPP were refreshed at each timepoint. Mean + SEM fold change live cell numbers from n = 3 replicates are shown. *, p<0.05; **, p<0.01 (two-tailed t-test). (E) Growth curve analysis of Cas9+ GM12878 LCL that express control (C) or independent RABGGTA-targeting sgRNAs, as indicated. Mean + SEM fold change live cell numbers from n = 4 replicates are shown. **, p<0.01; ***, p<0.005 (two-tailed t-test). Below, representative immunoblots (n = 2) of RABGGTA and tubulin load-control levels in WCL from LCLs expressing the indicated sgRNA are shown. (F) Growth curve analysis of Cas9+ GM12878 LCL that express control (C) or independent RABGGTB-targeting sgRNAs, as indicated. Mean + SEM fold change live cell numbers from n = 4 replicates are shown. *, p<0.05; **, p<0.01; ***, p<0.005 (two-tailed t-test). Below, representative immunoblot analysis (n = 2) of RABGGTB and tubulin load-control levels in WCL from LCLs expressing the indicated sgRNA are shown. (G) Growth curve analysis of Cas9+ GM12878 LCL that express control or independent PGGT1B-targeting sgRNAs are shown. Mean + SEM fold change live cell numbers from n = 4 replicates are shown. Below, representative immunoblot analysis (n = 2) of PGGT1B and GAPDH load-control levels in WCL from LCLs expressing the indicated sgRNA are shown.

