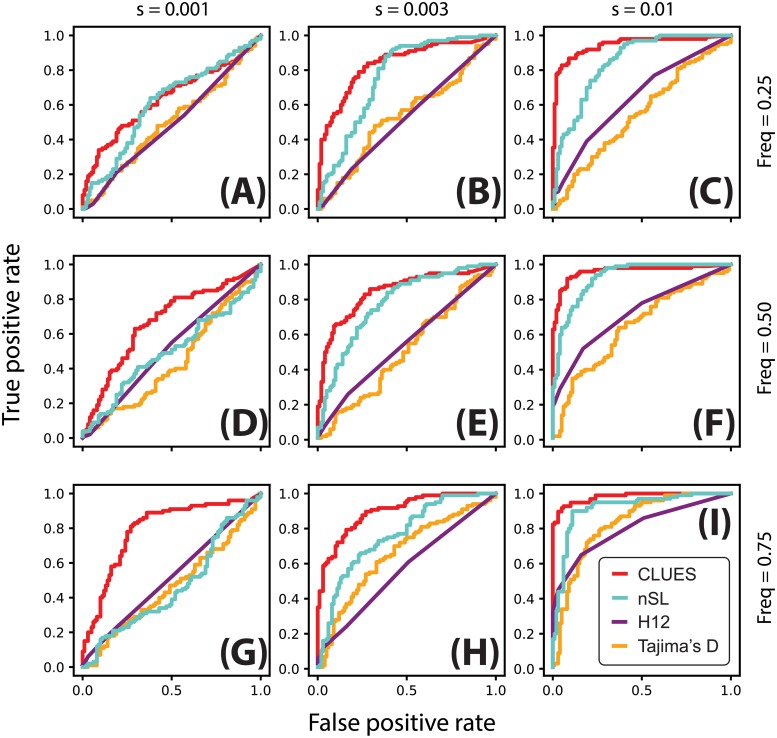
Fig 4. ROC curves illustrating performance of tests between selection and neutrality.
Rows correspond to simulations conditioned on the same present-day allele frequency (A-C: 25%; D-F: 50%; G-I: 75%), and columns correspond to simulations with the same value of s (A,D,G: 0.001; B,E,H: 0.003; C,F,I: 0.01). Simulations were performed under a model of European demography using a locus of 200kb, n = 25 diploid individuals and μ = 2.5 × 10⁻⁸ mut/bp/gen, r = 1.25 × 10⁻⁸ recombinations/bp/gen.

