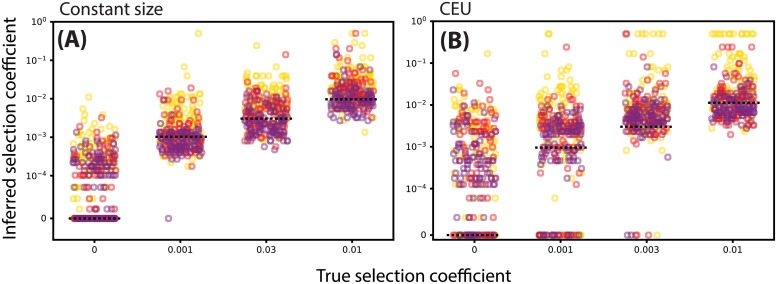
Fig 5. Inference of selection coefficients of varying strength using importance sampling method based on ARGweaver local trees.
A: Constant population size. B: Tennessen CEU model. Marker color denotes present-day allele frequency (25/50/75% correspond to yellow/red/purple, respectively). Horizontal dashed lines denote the true value of the selection coefficient.

