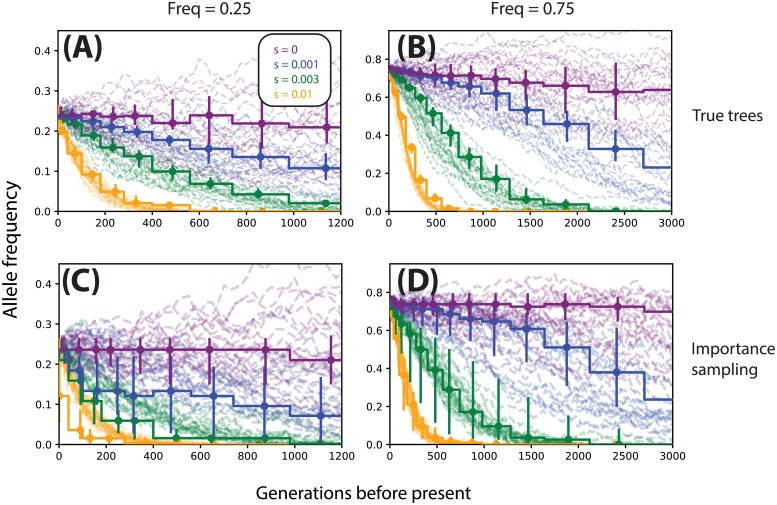
Fig 6. Allele frequency trajectories inferred from true trees (A,B) and ARGweaver local trees (C,D).
Stepwise trajectories are inferred (vertical bars denote 25th-75th percentiles), dashed trajectories are the ground truth. Columns correspond to different initial allele frequencies (A,C: 25%, B,D: 75%) colors correspond to different selection coefficients. For each condition we show 25 randomly selected simulations and their corresponding inferences. All data are simulated under a model of constant effective population size (Ne = 104).

