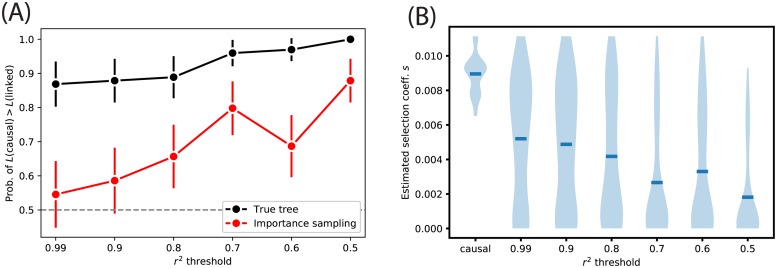
Fig 8.
(A) Probability of correctly identifying the selected site in a head-to-head test with a linked neutral site. Vertical bars represent 95% CIs estimated by plug-in bootstrap. (B) Estimates of the selection coefficient at the causal vs. linked neutral sites, given the true tree. Mean estimates are represented by blue hash marks.

