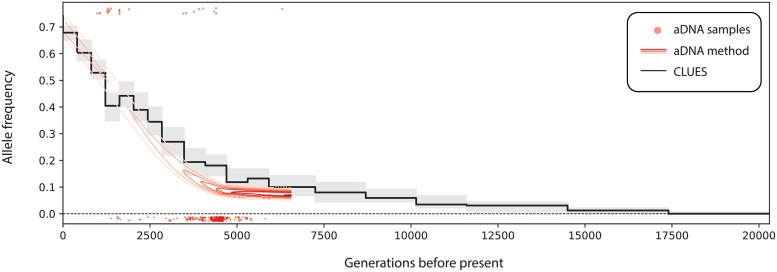
Fig 9. Comparison of inferred allele frequency trajectories for a sweep at rs4988235 (MCM6) in GBR under an ancient DNA (aDNA) based method vs. CLUES, which only uses contemporary modern data.
Black curve is the posterior median allele frequency, whereas gray areas are a 95% posterior interval. The red surface is the posterior of the frequency trajectory within Steppe ancestry conditioned on an ancient DNA time series, adapted from [55].

