
Figure 4.
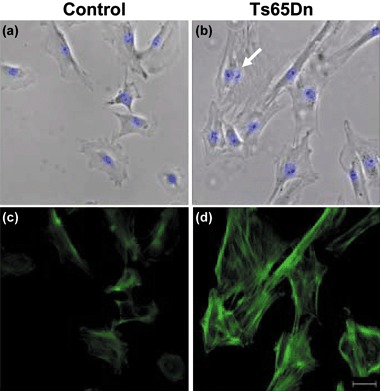
Morphology of fibroblasts from control and Ts65Dn mice. (a–d) Images of fibroblasts at the second passage in culture from a control (a, c) and a Ts65Dn (b, d) mouse. (a, b) Phase‐contrast images merged with Hoechst nuclear staining fluorescent images. The arrow in (b) indicates a binucleate fibroblast. Note the enlarged morphology of fibroblasts from the Ts65Dn mouse. (c, d) Images showing actin fibres (F‐actin), visualized with fluorescein isothiocyanate‐conjugated phalloidin. Note the intense network of F‐actin in fibroblasts from the Ts65Dn mouse, a sign of senescence. Scale bar (20 µm) applies to (a–d).