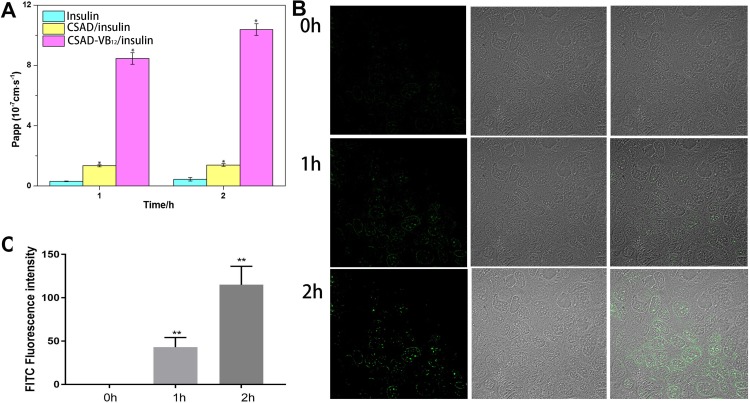
Figure 7.
Permeability and cellular uptake study. (A) Papp of different insulin formulations: insulin, the CASD/Insulin nanoparticles and the CASD-VB12/Insulin nanoparticles (n = 3; data shown are mean ± SD, *P < 0.05 in comparison with insulin group). (B) Confocal laser scanning microscopic images of Caco-2 cells incubated with the CSAD-VB12/FITC-insulin nanoparticles at 37°C for 2 hrs, and their overlay at the 0, 1, and 2 hrs after incubation. (C) The quantification of FITC in cells (values represented as the mean ± standard deviation (n = 3), **p <0.01, compared to 0 hr).

