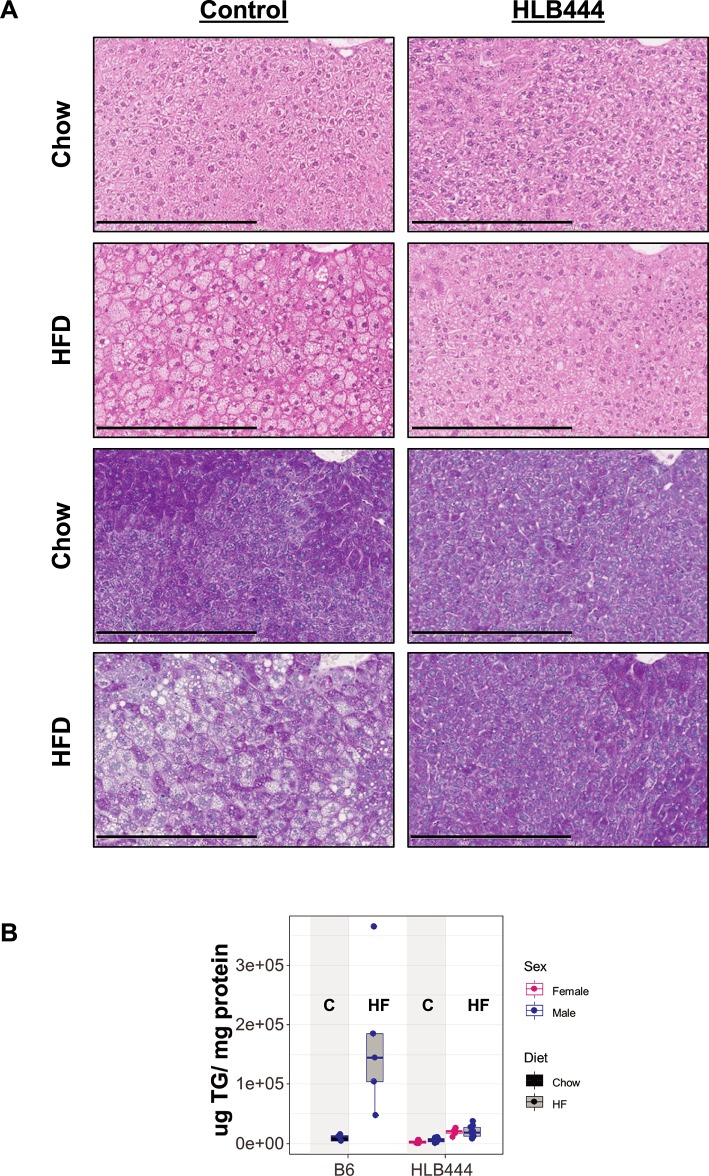
Fig 5. Liver histology on chow and high fat diets.
(A) Histologic sections of livers from control (left panels) and HLB444 (right panels) male mice fed chow or HF diet. Sections were stained with hematoxylin and eosin. Lower sections were also stained with PAS to evaluate glycogen content. Images are shown at 20x magnification. Black bar is 300μm. Mice were not fasted prior to tissue harvest. (B) Liver triglyceride content in control and HLB444 on chow and HF diet. Box and whisker plots show females values in red and male values in blue; chow values are filled with black; high-fat values are filled with gray. Vertical shading highlights chow values for each strain.

