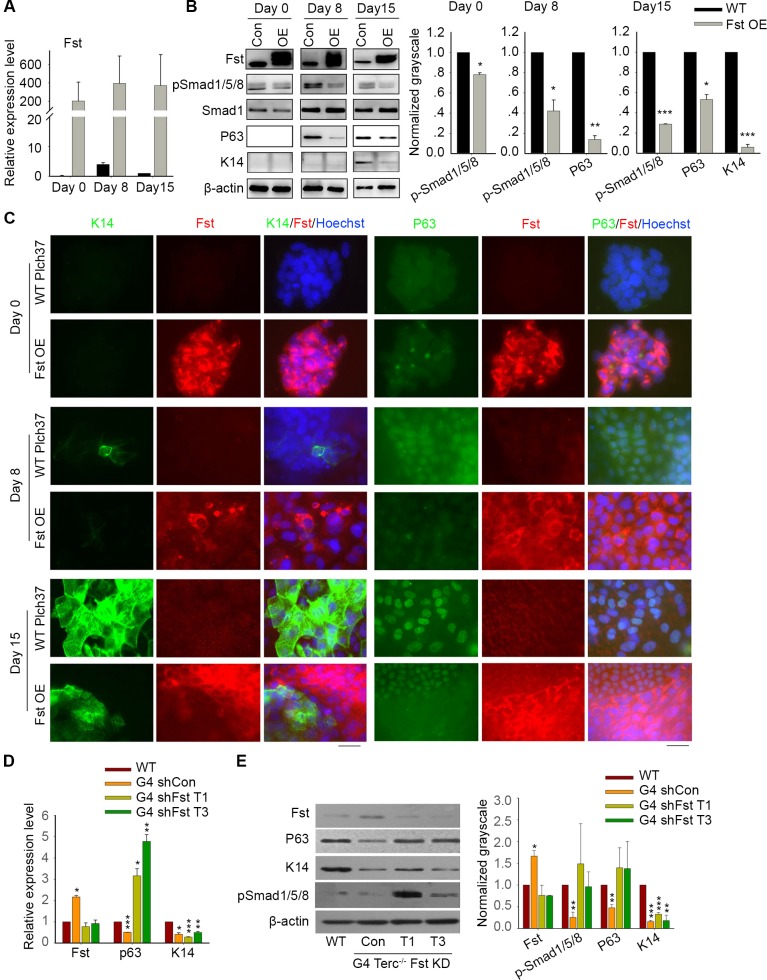
Fig 4. Fst inhibits pSmad, P63 and K14.
(A) Relative expression levels by qPCR of Fst during differentiation of WT ES cells stably overexpressing Fst (OE), compared with WT ES cells transfected with empty vector served as controls (Con). Bars = Mean ± SEM (n = 3). (B) Protein levels of Fst, Smad, pSmad, P63 and K14 by Western blot in Fst overexpressed ES cells compared with controls. Right panel, quantification of proteins level using ImageJ software, normalized to β-actin. *, p<0.05; **, p<0.01; ***p<0.001, compared to controls. (C) Overexpression (OE) of Fst in ES cells decreases expression of P63 and K14 by immunofluorescence microscopy. While WT ES cells transfected with construct Plch37 served as control express Fst at only a low level, ES cells stably overexpressing Fst express Fst at a much higher level by immunofluorescence microscopy. Following differentiation of ES cells overexpressing Fst, immunofluorescence staining of cytoplasmic K14 and nuclear P63 is dramatically reduced, compared with that of Plch37 plasmid controls. Scale bar = 20 μm. (D&E) Knockdown (KD) of Fst in G4 Terc–/–cells at day 15 of differentiation leads to increased mRNA levels of P63 by qPCR (D) and also elevated protein levels of pSmad1/5/8 and P63 by Western blot (E). Right panel, quantification of protein levels using ImageJ software, normalized to β-actin. *, p<0.05; **, p<0.01; ***p<0.001, compared to WT. T1 and T3 are two independent interference RNA sequences targeting Fst.

