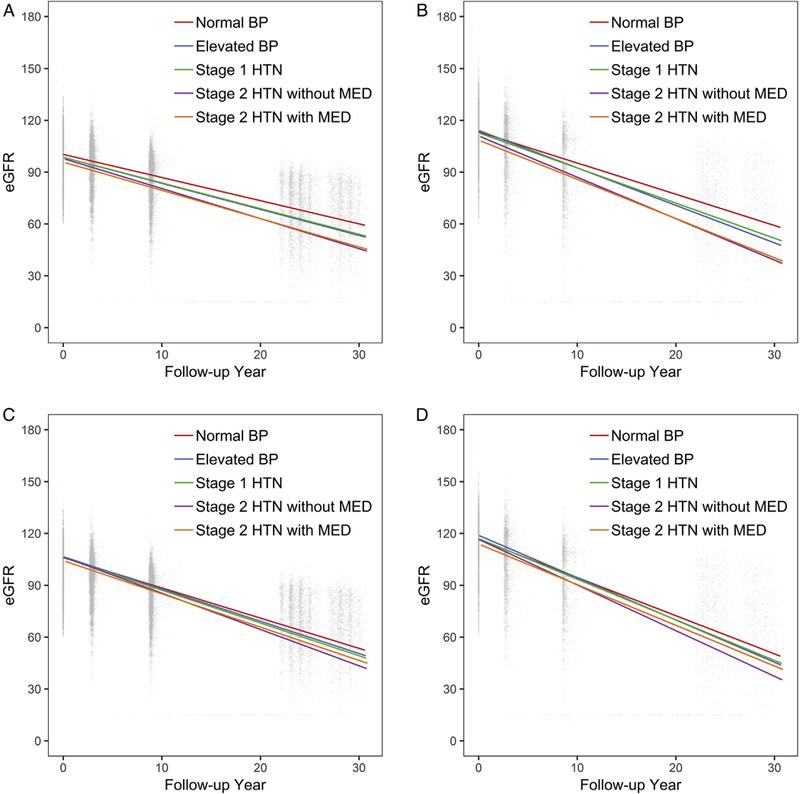
Figure 1.

Distribution of estimated glomerular filtration rates (eGFRs; mL/min/1.73 m2) and unadjusted and adjusted eGFR change during 30 years’ follow-up according to baseline hypertension (HTN) status. Unadjusted eGFR change among (A) whites and (B) African Americans and adjusted eGFR change among (C) whites and (D) African Americans. For adjusted eGFR changes, model adjusted for age (centered at 50 years old), sex (reference group: male), center (reference group: Forsyth County, NC), baseline smoking status (reference group: current smoker), baseline education level (reference group: non-high school graduate), baseline annual family income (reference group: <$25,000), baseline body mass index (centered at 25 kg/m2), baseline high-density lipoprotein cholesterol level (centered at 40 mg/dL), baseline history of diabetes (reference group: no diabetes), baseline history of coronary heart disease (reference group: no coronary heart disease), and their interaction with follow-up time. For adjusted predicted average annual changes among African Americans, African Americans in the Minnesota and Washington County cohorts were excluded in the adjusted model because of small numbers. Numbers of participants at each visit are: visit 1: whites, n = 11,003; African Americans, n = 3,851; visit 2: whites, n = 10,297 (93.6% of the original cohort); African Americans, n = 3,224 (83.7% of the original cohort); visit 4: whites, n = 8,616 (78.3%); African Americans, n = 2,373 (61.6%); visit 5: whites, n = 4,758 (43.2%); African Americans, n = 1,375 (35.7%); visit 6: whites, n = 2,995 (27.2%); African Americans, n = 1,013 (26.3%). Total number of eGFR assessments was 49,502, and the median of eGFR assessments was 3 (IQR, 3–4). Abbreviations: BP, blood pressure; MED, medication.
