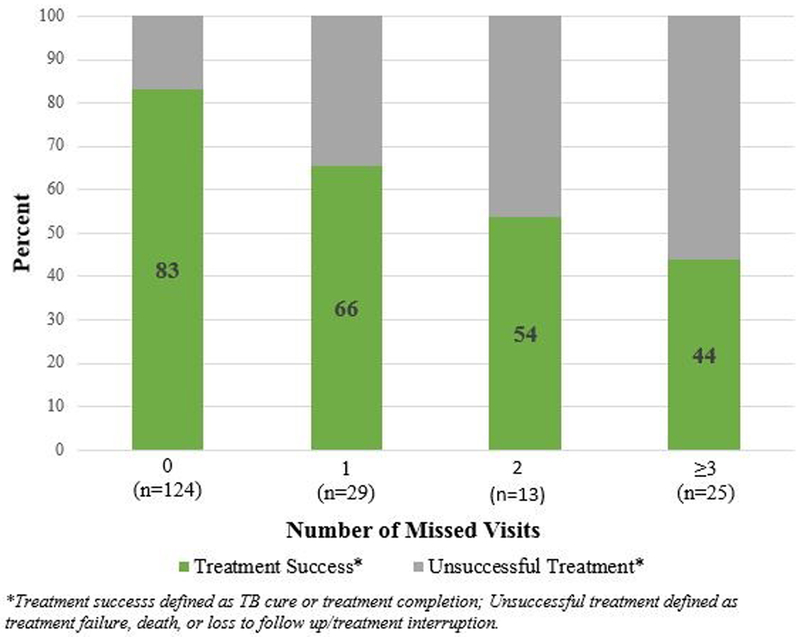
Figure 1. MDR-TB treatment cure rate by number of missed clinic visits during the first twelve months of MDR-TB treatment (n=191).
The rate of MDR-TB treatment success, defined as cure or treatment completion, was graphed by the number of missed clinic visits in the first year of MDR-TB treatment. The MDR-TB treatment success rate decreases with every additional missed clinic visit in the first year of treatment.

