
Fig. 1.
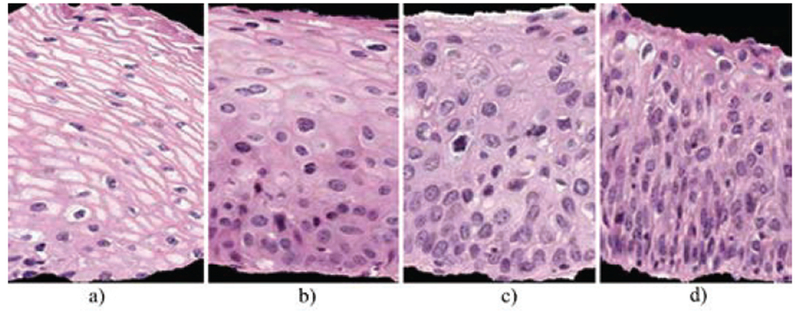
CIN grade label examples highlighting the increase of immature atypical cells from epithelium bottom to top with increasing CIN severity. (a) Normal, (b) CIN 1, (c) CIN 2, (d) CIN 3.
Official websites use .gov
A
.gov website belongs to an official
government organization in the United States.
Secure .gov websites use HTTPS
A lock (
) or https:// means you've safely
connected to the .gov website. Share sensitive
information only on official, secure websites.
CIN grade label examples highlighting the increase of immature atypical cells from epithelium bottom to top with increasing CIN severity. (a) Normal, (b) CIN 1, (c) CIN 2, (d) CIN 3.