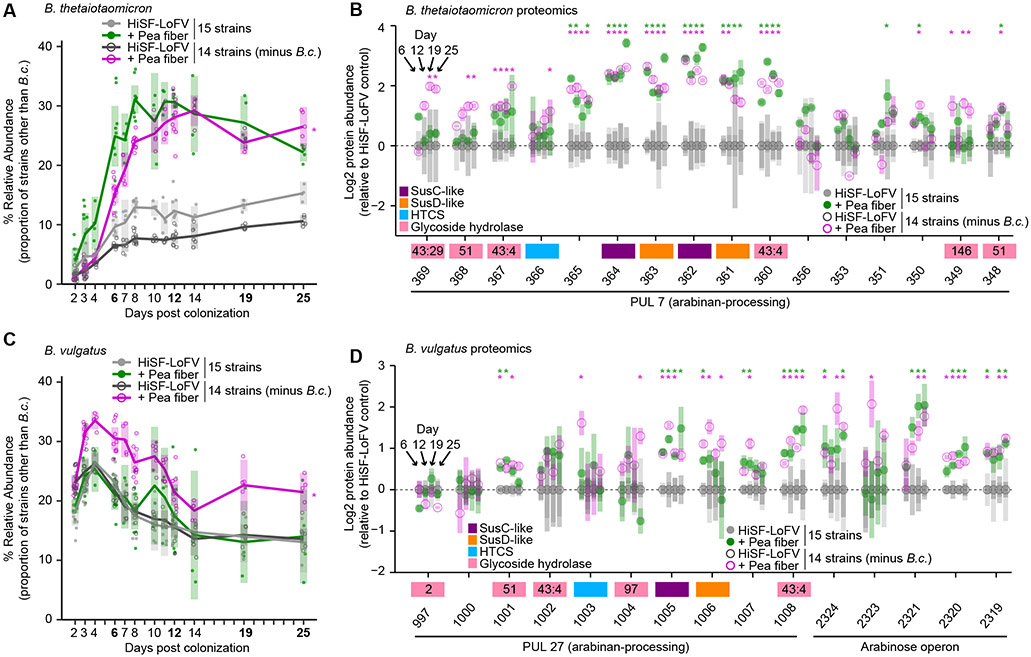
Figure 3. Deliberate manipulation of community composition demonstrates interspecies competition for pea fiber arabinan.
(A,B) Relative abundance of each bacterial strain in fecal samples from gnotobiotic mice harboring the 15-member community. Mice were fed the control HiSF-LoFV diet in the presence (light grey, closed circles), or absence (dark grey, open circles) of B. cellulosilyticus (B.c.), or fed the HiSF-LoFV diet + 10% (w/w) pea fiber in the presence (green, closed circles) or absence (magenta, open circles) of B.c. Key: circles, individual mice; lines, mean values; shading, 95%CI (n=4-10 mice per group). *, P < 0.05; (diet-by-community interaction; ANOVA). (C,D) Proteomics analysis of fecal communities sampled on experimental days 6, 12, 19, and 25. Genes in PULs of interest are shown along the x-axis (as locus tag number only; BT_XXXX or BVU_XXXX). Mean values ± SD (vertical shading) are indicated (n=5 animals/treatment group). Genes are color-coded according to their functional annotation (see key). GH families for enzymes in the CAZy database are shown as numbers inside the gene boxes. Key for circles is identical to that used in panels A and B. *, P < 0.05, ∣fold change∣ > log2(1.2) (HiSF-LoFV + pea fiber versus HiSF-LoFV diet; limma).

