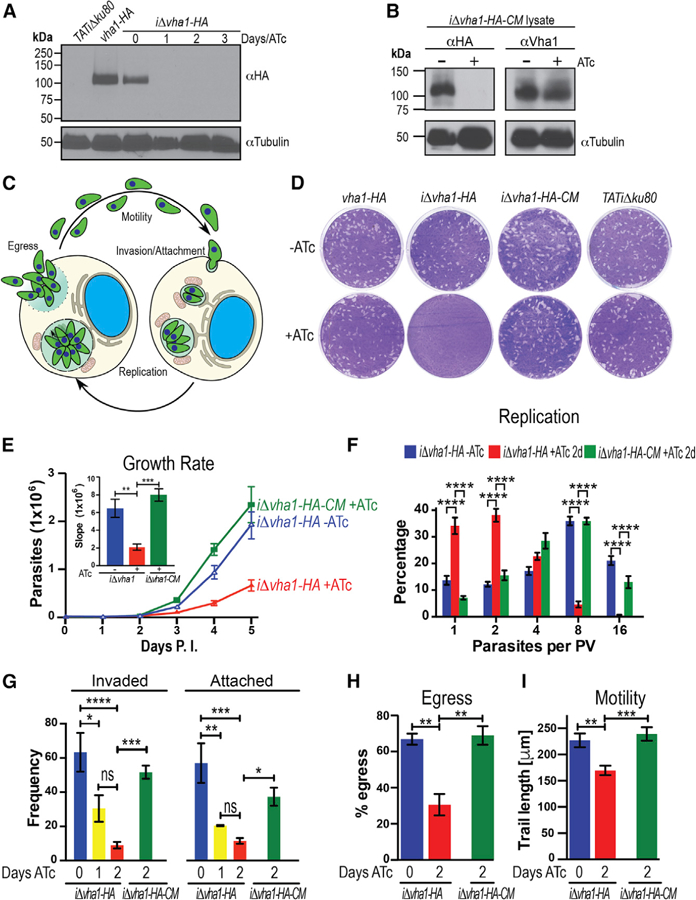
Figure 3. The V-ATPase and the T. gondii Lytic Cycle.

(A) Western blots of lysates from parental (TATiΔku80), vha1-HA, and iΔvha1-HA grown + or ATc parasites. Immunoblots were developed with rat αHA (1:200). Anti-tubulin was the loading control.
(B) Western blots of lysates of iΔvha1-HA-CM parasites showing no expression of the endogenous copy of vha1 in the presence of ATc, while the extra copy of Vha1 was constitutively expressed as evident with the mouse aVha1 antibody (1:500) (see Figure S2H for more details on the antibody).
(C) Overview of the lytic cycle. Adapted from Hortua Triana et al. (2018).
(D) Plaque assays of vha1-HA, iΔvha1-HA, iΔvha1-HA-CM, and TATiΔku80 clones grown + or ATc (0.5 mg/mL). Each well was infected with 200 parasites and grown for 8 days, fixed, and stained with crystal violet.
(E) 4,000 tdTomato-expressing parasites were grown in hTERT cells for 5 days. Data are presented as the average of three independent trials done in triplicate. Inset: slopes from days 2–5.
(F) Growth kinetics of iΔvha1-HA and iΔvha1-HA-CM + or ATc. Parasites from 115 to 150 PVs were counted per clone in three independent trials.
(G) Red-green assay for quantification of attachment and invasion of T. gondii. Data were from three to four independent experiments counting 10 random fields per clone.
(H) Egress triggered with 10 mM nigericin for 30 min at 37°C. Data were from three independent experiments counting 10 random fields per clone and comparing them to a DMSO control. Only PVs with two or more parasites were enumerated.
(I) tdTomato-expressing parasites were re-suspended in Ringer’s buffer without Ca2+, and motility was stimulated with 1.8 mM Ca2+. The average length (microns) parasites traveled is reported from five to six individual parasites from three independent trails. Values are means ± SEM.
(E) and (F) were compared with two-way ANOVA test and (G), (H), and (I) were compared with one-way ANOVA test, where *p < 0.05, **p < 0.01, ***p < 0.001, and ****p < 0.0001.
