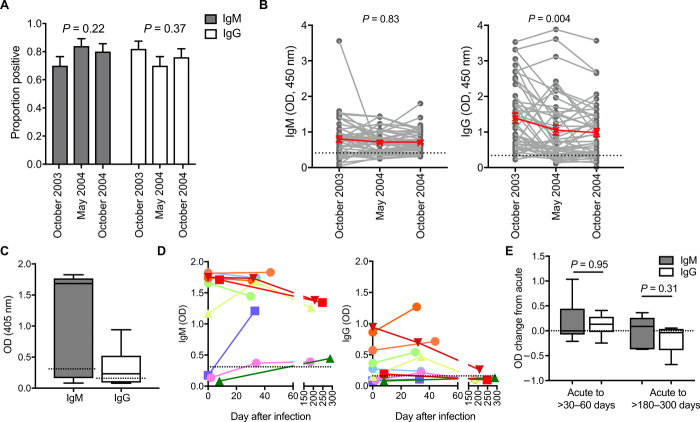
Fig. 3. Maintenance of P. falciparum specific IgM and IgG.
(A and B) IgM and IgG binding to recombinant MSP2 was measured in children from Ngerenya, Kenya who had no detectable parasite infection in October 2003, May 2004, and October 2004, during a period of rapidly declining transmission (n = 50). (A) IgM and IgG prevalence at the three time points (seropositive defined as greater than means + 3SDs of reactivity of malaria-naïve donors). P is Chi-square test. (B) Magnitudes of IgM and IgG reactivity over three time points. P value is calculated by nonparametric ANOVA and Friedman test. Dotted line indicates positive threshold calculated from means + 3SDs of reactivity of malaria-naïve donors. (C) IgM and IgG binding to recombinant MSP2 during clinical malaria in Australian returned travelers (n = 10). Dotted line indicates the seropositive threshold. (D) Magnitudes of IgM and IgG were measured at different time points following acute illness and treatment (n = 10). Colored lines correspond to different individuals. Dotted line indicates seropositive threshold. (E) There was no significant difference in the change in IgG and IgM levels at 30 to 60 days (n = 8) or between 180 to 300 days (n = 5) after disease compared to clinical time point (measured 0 to 7 days following treatment). Dotted line indicates no change. P values were calculated using the Wilcoxon matched-pairs signed-rank test.

