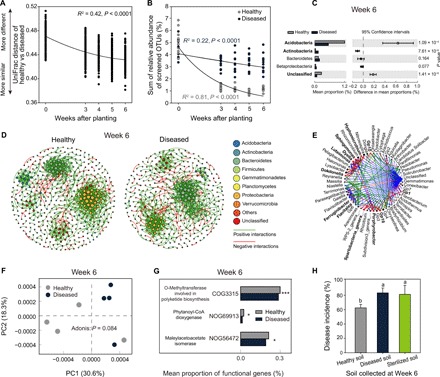
Fig. 3. Taxonomic and functional differences between healthy and diseased plant microbiomes persist throughout the tomato growth season and can be transferred to the next plant generation via soil transplantation.

(A) Decay in the phylogenetic distance (unweighted UniFrac distance) between microbiomes associated with healthy and diseased plants. (B) Temporal dynamics of the relative abundance of rare OTUs enriched in the initial microbiomes of healthy and diseased plants. (C) Differences in the abundances of rare discriminating OTUs (linear discriminant analysis score ≥ 2, fold change ≥ 2, and significance test P < 0.05) associated with healthy and diseased plant microbiomes at the end of the experiment (week 6). P values were calculated using Student’s t test (P < 0.05), and significantly associated phyla are highlighted in bold. (D) Co-occurrence networks associated with healthy (left) and diseased plants (right) at the end of the experiment (week 6). (E) Potential driver taxa behind pathogen suppression based on bacterial network analysis of healthy and diseased plant microbiomes at the end of the experiment (week 6). Node sizes are proportional to their scaled NESH score (a score identifying important microbial taxa of microbial association networks), and a node is colored red if its betweenness increases when comparing soil microbiomes associated with diseased to healthy plants. As a result, large red nodes denote particularly important driver taxa behind pathogen suppression, and these taxa names are shown in bold. Line colors indicate node (taxa) connections as follows: association present only in healthy plant microbiomes (red edges), association present only in diseased plant microbiomes (green edges), and association present in both healthy and diseased plant microbiomes (blue edges). (F) Distinct functional gene profiles associated with healthy and diseased plant microbiomes at the end of the experiment (week 6). (G) The abundance of representative genes related to secondary metabolism synthesis of healthy and diseased plant microbiomes at the end of the experiment (week 6). (H) The disease incidence in the second plant generation after transplantation of soil from the first-generation healthy, diseased, or sterilized healthy soil (mean ± SD, n = 4). Different lowercase letters denote significance at P < 0.05 (Duncan’s multiple range test).
