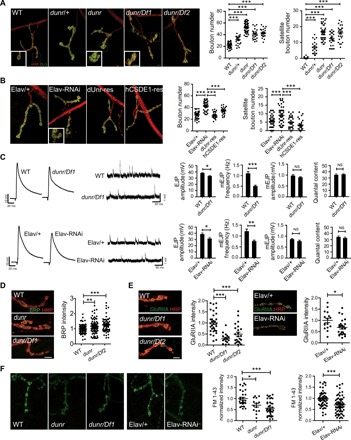
Fig. 4. Disruption of dUnr interferes with synapse development and transmission in Drosophila.

(A) Left: Representative NMJ4 synapses of dUnr-related lines (WT, dunr/+, dunr, dunr/Df1, and dunr/Df2). Right: Both bouton number and satellite bouton number were increased in dunr/+ line (n = 22), dunr line (n = 58), dunr/Df1 line (n = 23), and dunr/Df2 line (n = 25) compared to control (n = 61). The boutons were costained with anti-HRP labeling the neuronal plasma membrane (red) and anti-DLG (green) labeling a postsynaptic scaffold protein. Magnified image of the boxed region at left bottom shows the terminal bouton or the satellite bouton. Scale bar, 5 μm. (B) Left: Representative NMJ4 morphology of the Elav/+ line, a pan-neuronal dUnr KD line (Elav-RNAi), a Drosophila UNR rescue line (dUnr-res), and a human CSDE1 rescue line (hCSDE1-res). Right: Both bouton number and satellite bouton number were increased in Elav-RNAi line (n = 45) compared to Elav/+ line (n = 45). In dUnr-res line (n = 34) and hCSDE1-res line (n = 28), the numbers were decreased compared to Elav-RNAi line (n = 45). Scale bar, 5 μm. (C) Left: Representative traces of EJPs and mEJPs in the indicated genotypes. Right: The amplitudes of EJPs were mildly decreased in both dunr/Df1 line (WT: n = 9; dunr/Df1: n = 13) and pan-neuron KD line (Elav/+: n = 29; Elav-RNAi: n = 17). Slightly but not significantly decreased mEJP amplitude and no significant change of quantal content were observed on both KD and dunr/Df1 lines. NS, not significant. (D) The normalized fluorescent intensity of BRP was slightly increased in dunr (n = 76) and dunr/Df1 (n = 63) lines compared to controls. Scale bar, 5 μm. (E) The normalized fluorescent intensity of postsynaptic GluRIIA was markedly reduced in dunr/Df1 (n = 18), dunr/Df2 (n = 23), and KD lines (n = 25) compared to controls. Scale bar, 5 μm. (F) Decreased normalized fluorescent intensity of FM 1-43 dye was detected in dunr (n = 14), dunr/Df1 (n = 40), and KD (n = 61) lines compared to controls. Scale bar, 5 μm. Statistical data were presented as means ± SEM. *P < 0.05, **P < 0.01, and ***P < 0.001.
