
Fig. 1. Cas and NF-κB are mechanically modulated in osteocytes in vivo and in vitro.
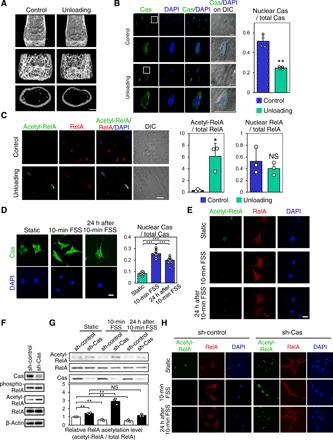
(A) Reduction in bone mass by hemilateral hindlimb unloading. Representative microcomputed tomography (μCT) images of mouse distal femurs are shown. Scale bar, 1 mm. (B) Loading-dependent change of Cas distribution in osteocytes in vivo. Confocal images of anti-Cas immunofluorescence (green) and nuclear [4′,6-diamidino-2-phenylindole (DAPI), blue] staining of osteocytes in midshaft tibiae are shown together with their DIC (differential interference contrast) images (left). The lower panels show higher-magnification images from regions highlighted by boxes in the upper panels. Scale bars, 10 μm. Quantitation of the nuclear distribution of Cas (right, n = 4 mice; each value was averaged from four to six osteocytes analyzed in each bone). (C) Increased RelA acetylation in osteocytes of unloaded bones. Confocal images of anti–acetylated RelA (acetyl-RelA, green), anti-RelA (RelA, red), and nuclear (DAPI) staining of osteocytes in midshaft tibiae are shown (left). Scale bar, 10 μm. RelA acetylation (center) and nuclear distribution (right) were quantified. RelA acetylation was scaled with the mean value of control bones (column 1) set at 1 (n = 3 mice per group, each value was averaged from four to six osteocytes analyzed in each bone). (D and E) FSS-induced increase of Cas nuclear distribution and decrease of RelA acetylation in MLO-Y4 osteocytes. Confocal images of anti-Cas (D, green), anti–acetylated RelA (E, green), and anti-RelA (E, red) immunofluorescence and nuclear (DAPI) staining of MLO-Y4 osteocytes in static culture, immediately and 24 hours after 10-min pulsatile FSS. Scale bar, 20 μm. Nuclear distribution of Cas was quantified as in (B) (n = 10 per group). (F) Cas-dependent decrease of RelA acetylation in MLO-Y4 osteocytes. RelA acetylation and phosphorylation in MLO-Y4 osteocytes infected with sh-Cas–expressing (sh-Cas) or its control (sh-control) retrovirus were analyzed by immunoblotting. Note that RelA phosphorylation was not affected by Cas knockdown. (G) Cas-dependent FSS-induced decrease of RelA acetylation in MLO-Y4 osteocytes. MLO-Y4 osteocytes with (sh-Cas) and without (sh-control) Cas knockdown, in static culture, and immediately or 24 hours after 10-min pulsatile FSS application, were analyzed by immunoblotting (top). The levels of RelA acetylation (acetyl-RelA/total RelA) were normalized against the static controls, which were set at 1 (bottom, n = 3). (H) Confocal images showing anti–acetylated RelA (acetyl-RelA) (green) and anti-RelA (red) immunofluorescence in MLO-Y4 osteocytes, with (sh-Cas) and without (sh-control) Cas knockdown, in static culture (top) or immediately (middle) and 24 hours (bottom) after 10-min pulsatile FSS. Nuclei were stained with DAPI (blue). Scale bar, 20 μm.