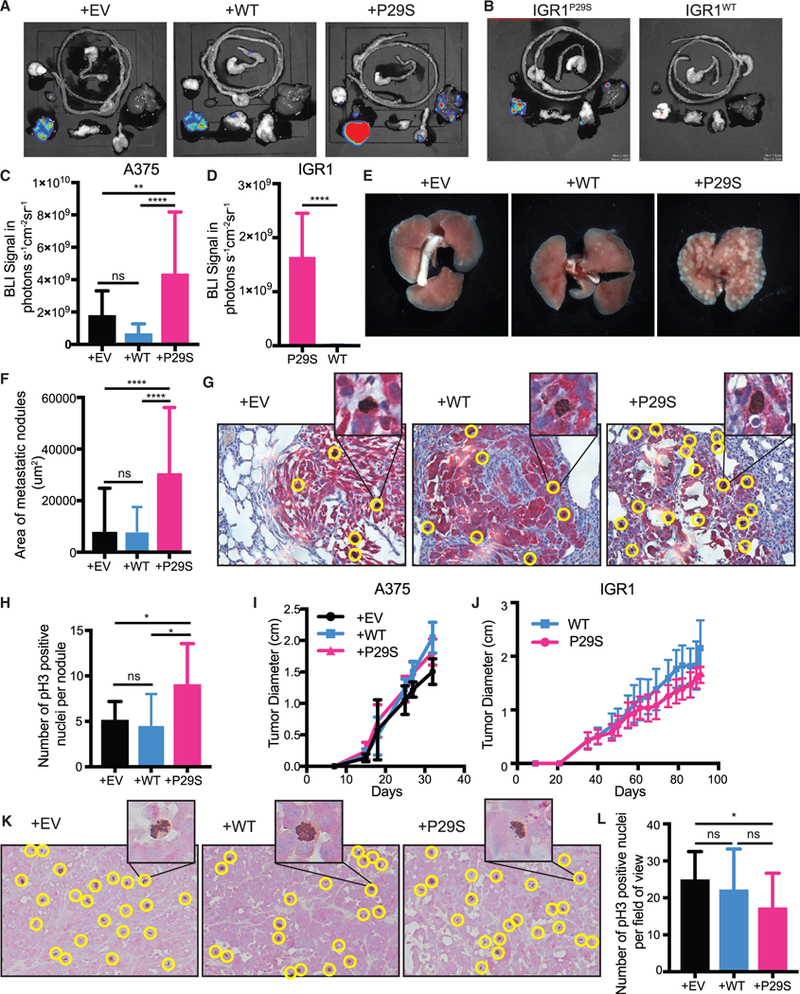
Figure 1. Rac1P29S Confers Growth Advantage to Melanoma Cells in Metastases.

(A-E) Endpoint metastatic burden in mice with tumors that were between 2.0–2.5 cm. A375, n = 20 mice per condition from two independent experiments, IGR1, n = 10 mice per condition, see also Data S1.
(A-D) Bioluminescence imaging (BLI) signal detected in dissected organs.
(E) Macrometastases in gross lungs post fixation in 10% neutral-buffered formalin for 48 h.
(F-H) Paraffin-embedded lungs were sectioned and dual-labeled with anti-dsRed antibody for tumor nodule detection and anti-phospho Histone 3 for detection of mitotic nuclei.
(F) Area of metastatic nodules determined using pixel classification of dsRed staining by Ilastik machine learning software (Sommer et al., 2011).
(G) Representative images of dual staining of metastatic melanoma cells (red) and mitotic nuclei (brown, positive nuclei circled in yellow).
(H) All metastatic lung nodules controlled for size were randomized and hand counted for phospho-Histone 3 positive nuclei to determine number of proliferating cells (n ≥ 9 metastatic lung nodules for each condition).
(I and J) Growth of xenograft tumors in NSG mice from (I) A375 melanoma cells exogenously expressing Rac1P29S (+P29S), Rac1WT(+WT), or empty vector (+EV) (n = 20 mice precondition from two independent experiments) and from (J) IGR1 cells with endogenous Rac1 P29S(P29S) or endogenous Rac1WT(WT), reverted by CRISPR-Cas9 genome editing (n = 10 mice per condition).
(K and L) Paraffin-embedded primary-xenograft tumors were sectioned and dual-labeled with anti-dsRed antibody for tumor cell detection (red) and anti-phospho Histone 3 for detection of mitotic nuclei (brown).
(K) Positive nuclei, circled yellow in representative images, were (L) hand counted across each 20x magnification field of view acquired to determine number of proliferating cells (n ≥ 20 fields of view for each condition). All data represent mean ± SD. Statistical significance was assessed by one-way ANOVA with Tukey’s multiple comparisons test (C, F, H, and L) and unpaired Student’s t-test (D). *p < 0.05, **p < 0.01, ****p < 0.0001.
See also Figure S1.
