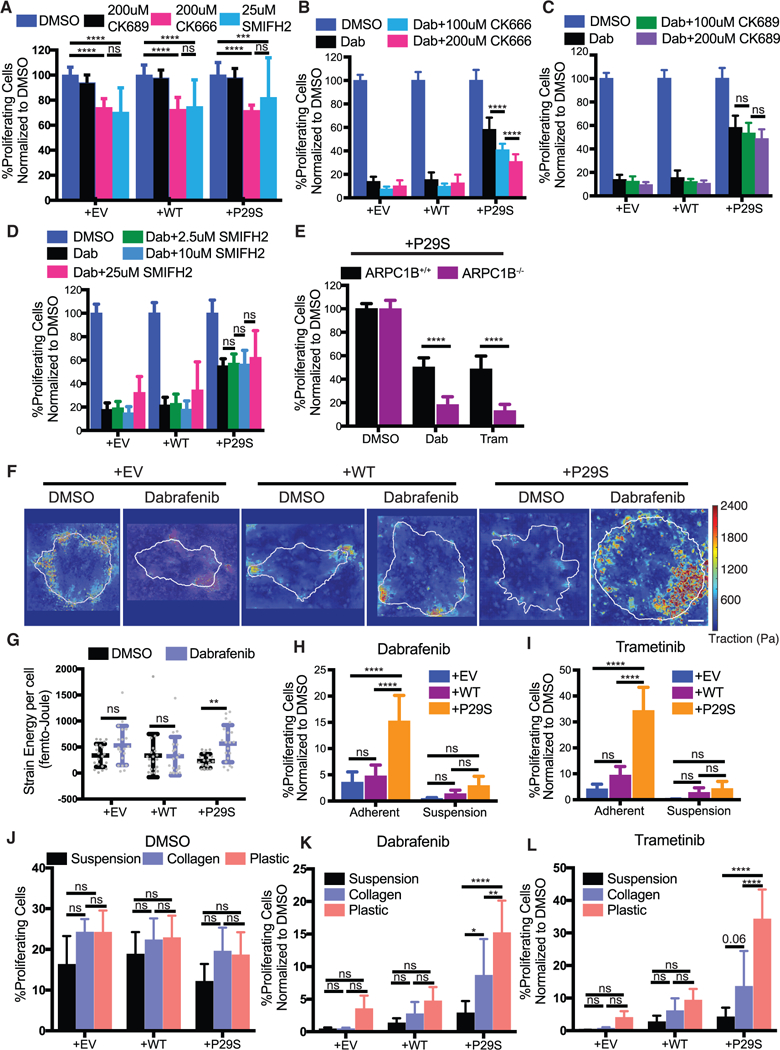
Figure 4. Enhanced Assembly of a Dendritic Actin Network Drives Rac1P29S’s Proliferative Advantage.

(A) Proliferation assay applied to A375 cells expressing Rac1 P29S(+P29S), Rac1WT(+WT), or empty vector (+EV) treated with DMSO (0.003%), the Arp2/3 complex Inhibitor CK666 (200 μM), the control peptide CK689 (200 μM), and the pan-formin inhibitor SMIFH2 (25 μM). Treatment of cells with CK666 or SMIFH2 alone suppresses proliferation to the same degree and similarly across all cell lines regardless of Rac1 status.
(B-D) Proliferation assay applied to+P29S, +WT, or +EV cells upon 48 h treatment with Dabrafenib (33.3 nM) along with indicated concentrations of (B) CK666, (C) CK689, and (D) SMIFH2.
(E) Proliferation assay applied to +P29S cells with CRISPR/Cas9-mediated knockout oftheArp2/3 regulatory component ARPC1B (ARPC1B−/−) and with control levels ofARPC1B (ARPC1B+/+). Both cell types were treated for48 h with DMSO (0.003%), Dabrafenib (33.3 nM), and Trametinib (3.3 nM). An unpaired Student’s t-test was used to determine statistical significance.
(F and G) Traction Force Microscopy (TFM) of +P29S, +WT, or +EV cells cultured on TFM substrates for 48 h with DMSO (0.003%) or Dabrafenib (33.3 nM) treatment.
(F) Representative traction force maps. Scale bar, 10 μm.
(G) Strain energy percell determined byTFM analysis increases upon MAPKi treatmentfor+P29S, but notfor+EVor+WTcontrol cells. A Mann-Whitneytestwas used to determine statistical significance because of non-normal distribution of the data determined using D’Agostino-Pearson omnibus normality test.
(H and I) Proliferation assay applied to+P29S, +WT, and +EV cells grown ontissue culture coated plastictofacilitate adhesion orin low-adhesion dishesto inhibit adhesion following 48 h treatment with (H) Dabrafenib (33.3 nM) and (I) Trametinib (3.3 nM).
(J-L) Proliferation assay assessedfor+P29S, +WT, or+EVcellscultured using indicated substratesandtreated with (J) DMSO (0.003%), (K) Dabrafenib(33.3 nM), or (L) Trametinib (3.3 nM) for 48 h.
Statistical significance was determined using a two-way ANOVA and Tukey’s multiple comparisons test for (A-D and H-L). All graphs represent mean ± SD. *p < 0.05, **p < 0.01, ***p < 0.001, ****p < 0.0001. See also Figure S4.
