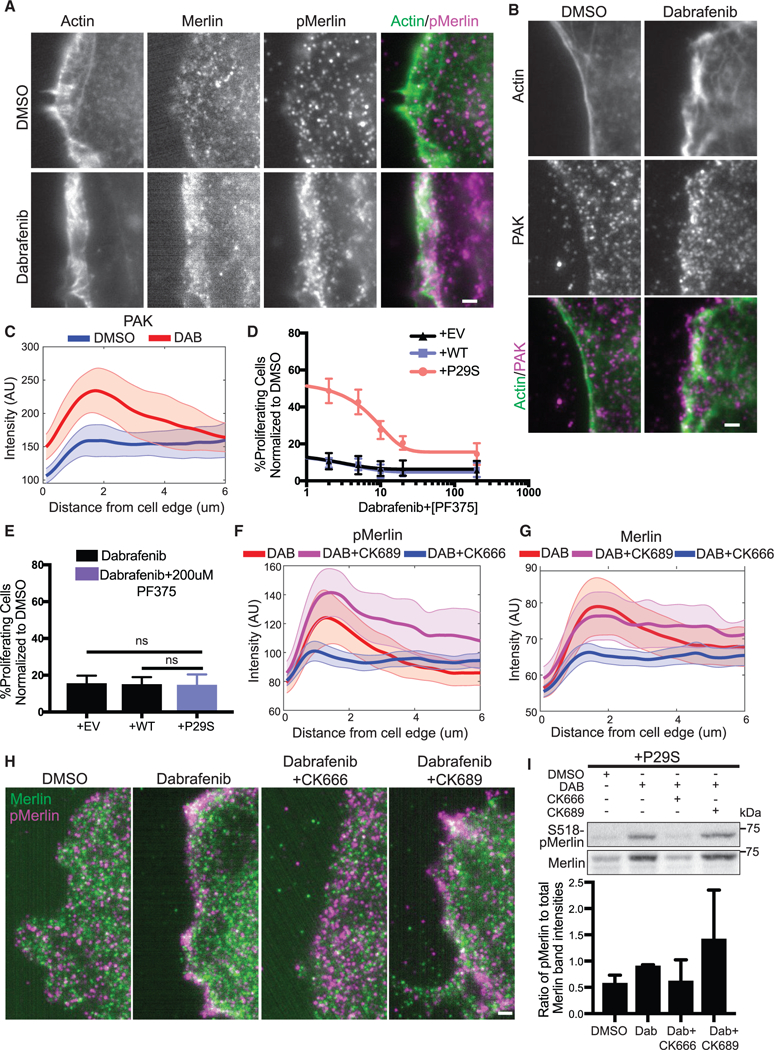
Figure 7. Enhanced Dendritic Actin Network in Rac1P29S Cells Sequesters and Inactivates Tumor Suppressor NF2/Merlin in Lamellipodia.

(Aand B) Fluorescent protein detection ofmNeonGreen-Actin-C-35and immunofluorescencedetection of(A) endogenoustotal Merlin and S518-phospho-Merlin and (B) endogenous PAK in A375 melanoma cells expressing Rac1P29S following 48 h treatment with DMSO (0.003%) and Dabrafenib (33.3nM). Scale bars, 2 μm.
(C) Averaged intensity curves of PAK as a function of a distance from the cell edge (0.1~6 μm); n = 12 (DMSO), n = 10 (DAB). Shaded areas indicate 95% confidence intervals at each distance.
(D) Proliferation dose response to increasing concentration ofthe PAK inhibitor PF3758309 (2.0, 5.0,10.0, 20.0, and 200.0 nM) when added in combination with Dabrafenib treatment (33.3 nM) for 48 h in A375 melanoma cells expressing Rac1P29S (+P29S), Rac1WT (+WT), or empty vector (+EV). Data are normalized to DMSO (0.003%) control.
(E) Combined Dabrafenib (33.3 nM) and PF3758309 (200 mM) treatment restores +P29S cells’ proliferative sensitivity to the level of control +EV and +WT cells treated with Dabrafenib (33.3 nM). Statistical significance was assessed using a using a one-way ANOVA and Tukey’s multiple comparisons test.
(F and G) Endogenous(F) S518-phospho-Merlin localization and (G)total Merlin localization in +P29S cellsasafunctionofdistancefromthecell edge(0.1~6 μm); averages are calculated first in distance bands per cell and then compiled over multiple cells upon three treatments; n = 9 (DAB, 33.3 nM), n = 11 (DAB, 33.3 nM+CK689, 200 μM), n = 15 (DAB, 33.3 nM+CK666, 200 μM). Shaded area indicates 95% confidence intervals at each distance.
(H) Immunofluorescence detection of endogenous total Merlin (green) S518-phospho-Merlin (magenta) in +P29S cellstreated as described in (F) and (G). Scale bar, 2 μm.
(I) Immunoblot of endogenous levels of total Merlin and inactive S518-phospho-Merlin in +P29S cells upon 48 h treatment with DMSO (0.003%), Dabrafenib (33.3 nM), and Dabrafenib (33.3 nM) in combination with CK666 (200 μM) or CK689 (200 μM). Data are representative ofthree independent experimentsforwhich quantification by densitometry is the pixel area under the curve of band intensities.
Bar graphs represent mean ± SD. See also Figure S7.
