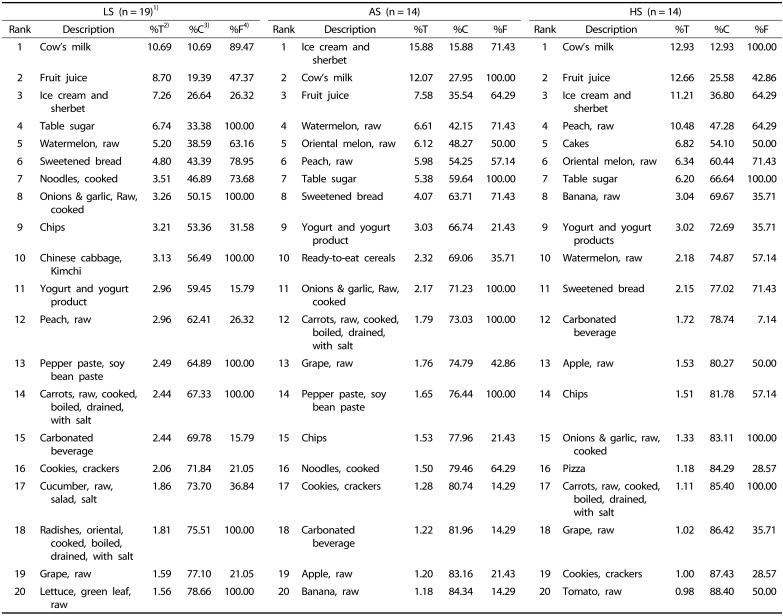
Table 6. Major sugar source food by sugar intake status in the educated group.
1)LS, < 10% (low total sugar intake segment); AS, 10–20% (adequate total sugar intake segment); HS, ≥ 20% (high total sugar intake segment).
2)Percent of total sugar intake
3)Cumulative percent of total sugar intake
4)Percent frequency of population

