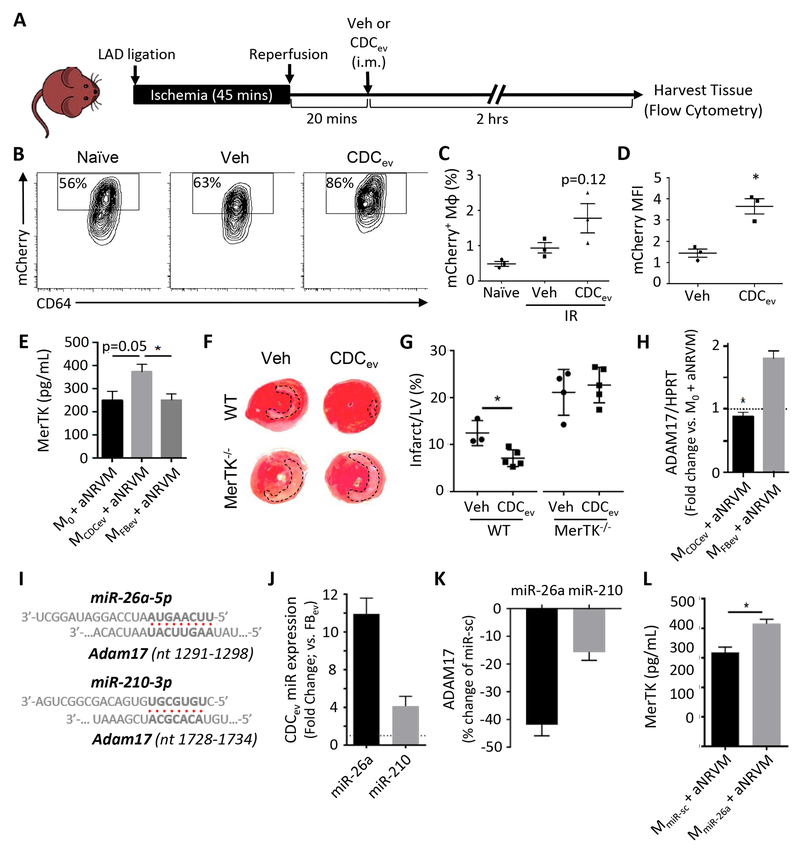
Figure 5. MerTK expression is required for enhanced efferocytosis and cardioprotection.
(A) Schematic of protocol used to assess efferocytosis of CDCev-treated mCherry mice post-IR. Veh: vehicle, i.m.: intramuscular. (B) Representative contour plots of mCherry expression in cardiac Mϕ (CD11b+Ly6G−Ly6CloF4/80+CD64+) isolated from hearts of naïve (no IR injury) or post-IR (vehicle or CDCev treatment) mice. (C and D) Percent and MFI of mCherry in cardiac Mϕ. MFI: mean fluorescence intensity. (E) Protein expression of MerTK as determined by ELISA 2 hours following aNRVM coculture. (F) Representative images of TTC-stained hearts 2 days following AMI. WT and MerTK−/− mice were treated with either Veh (saline) or CDCev 20 minutes following reperfusion (as in A). (G) Quantification of LV and infarct size from TTC-stained in (F). Statistical significance observed between WT vehicle and CDCev. LV: left ventricle. (H) Adam17 gene expression is suppressed in MCDCev. (I) Predicted binding sites of miR-26a-5p and miR-210–3p with Adam17 (nucleotide range denoted in brackets). (J) Fold change in expression of miR-26a and miR-210 in CDCev versus FBev. (K) Percent change in luciferase assay activity in HEK293T cells 2 days following treatment with miR-26, miR-210, or miR-sc. (L) Protein expression of MerTK in MmiR-sc and MmiR-26a co-cultured with aNRVM. Graphs depict mean +/− SEM with n=3–4/group. Statistical significance was determined using 2-tailed, unpaired, Student’s t test, or 1-way ANOVA followed by Tukey’s multiple corrections test. *p<0.05.

