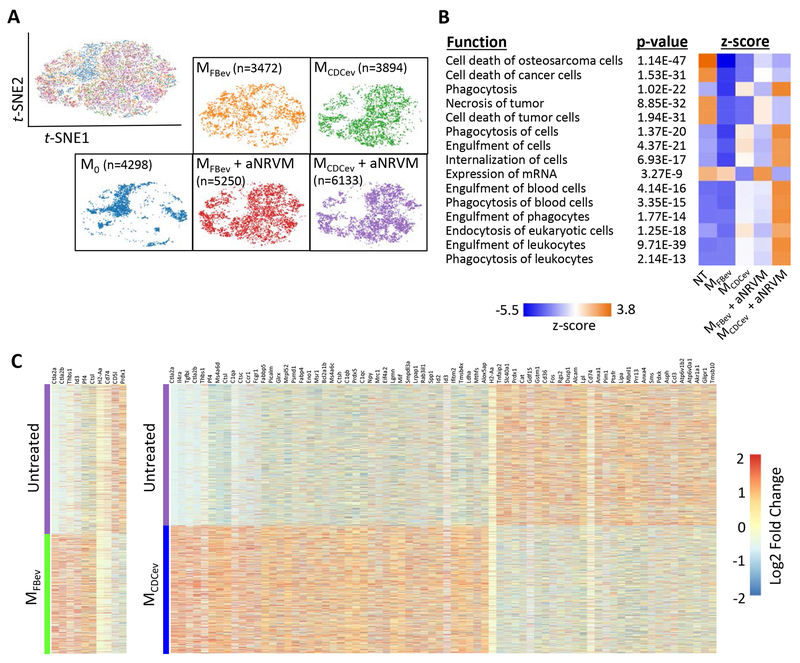
Figure 6. scRNA-seq reveals global changes in phagocytic gene expression.
(A) t-SNE plots of single cells from Mϕ treatment groups. Cell numbers analyzed per group denoted in brackets. (B) Pathway analysis of gene expression profiles related to cellular function ranked by z-score. (C) Heatmap of significantly different gene expression changes in Mϕ treated with or without EVs.

