Figure 1.

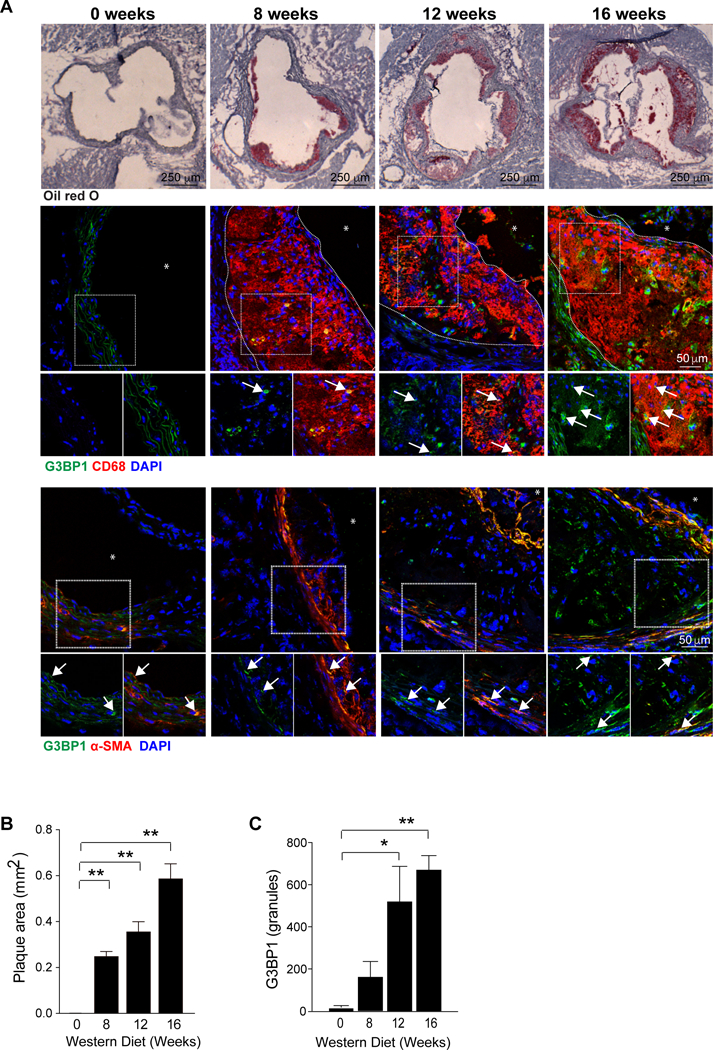
Stress granules are induced during atherogenesis and increase with disease progression. (A) Representative images of atherosclerotic plaques in the aortic root of LDLR−/− mice fed western diet for 0, 8, 12 and 16 weeks, and stained with oil red O stain to identify neutral lipid (top panel, 40X), the macrophage marker CD68 (red) and G3BP (green) (middle panel, 400X; * = lumen), and the smooth muscle cell marker alpha actin (red) and G3BP (green) (bottom panel, 40X; * = lumen). Arrows indicate co-stained cells. Plaque area has been outlined with a dotted line. (B-C) Quantification of plaque size (B) and G3BP1 fluorescence intensity in plaques (C). Data are the mean ± s.e.m. of n=6 mice per time point. Significance was determined by one-way analysis of variance (ANOVA) followed by post-test of Dunn. *P≤0.05, **P≤0.005.
