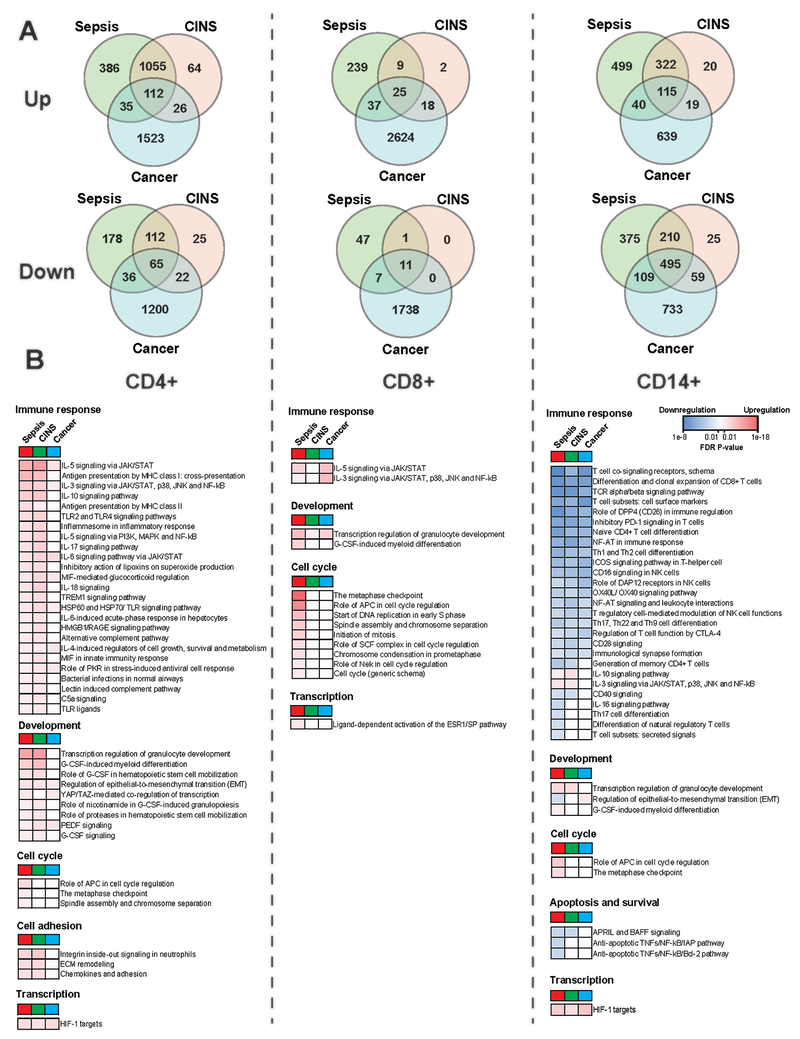
Fig2. Comparison of Differentially Expressed Genes DEGs and pathways across septic, Critically-Ill Non-Septic (CINS), and cancer groups:
A. Venn diagrams display numbers of DEGs from each cell type and group, with the overlap of found DEGs within each cell type across groupings. B. Many pathways found to be differentially expressed are displayed, and categorized into functional groupings. Comparisons of degree of significance across patient groups are shown for each of these pathways based upon False Discovery Rates (FDRs, Blue represents downregulation and red represents upregulation). FDRs for each group are as compared to the healthy group. (A) Note that there were significantly more changes in gene expression (both up and down regulated) in CD8 T cells in cancer patients as compared to septic or CINS patients. (B) Note the marked downregulation of immune response pathways in monocytes as compared to upregulation of pathways for CD4 and CD8 T cells, blue color shading for monocytes vs. red color for CD4 and CD8 T cells.

