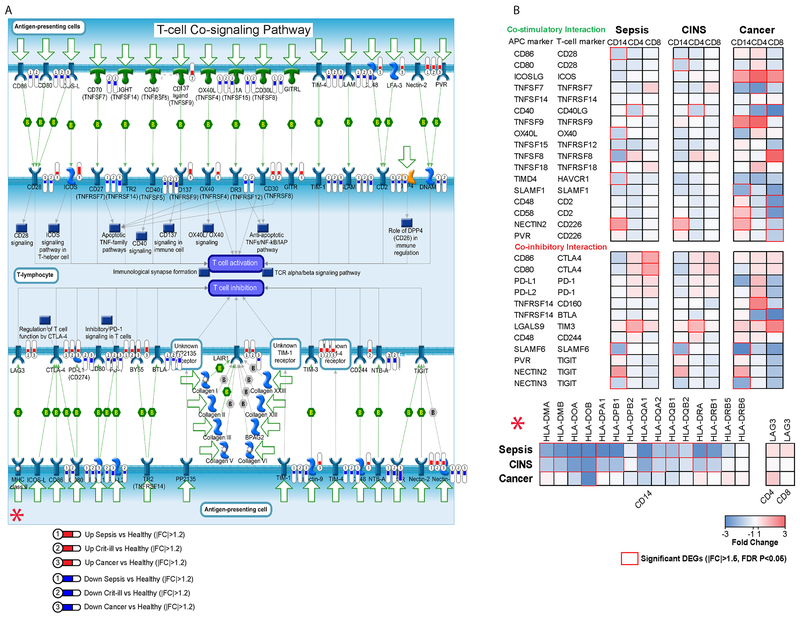
Fig3. Altered monocyte, CD4 Tcell interaction in sepsis, cancer, and critical illness:
Many of the molecules at the immunologic synapse showed altered expression, including several antigen presentation proteins. A. Bubbles represent that a gene was differentially expressed, numbers within them represent the patient population in which they were differentially expressed (1=Sepsis, 2=CINS, 3=Cancer). Blue colored bubbles represent downregulated genes while red colored bubbles represent upregulated genes. The amount of fill in the bubble indicates relative degree of altered expression, minimum 1.2 |FC|. B. Important immune synapse ligand/receptor pairs and antigen presentation molecules (HLAs) are shown with relative fold changes of specific genes. Red boxes represent significant DEGs (|FC|>1.5, FDR p<0.05). There was a more intense downregulation of antigen presentation molecules (HLAs) in septic and critically ill non-septic (CINS)patients vs cancer patients (lower right corner of figure). However, cancer patients had more intense downregulation of CD8 T cells vs septic or CINS patients (far upper right corner of figure).

