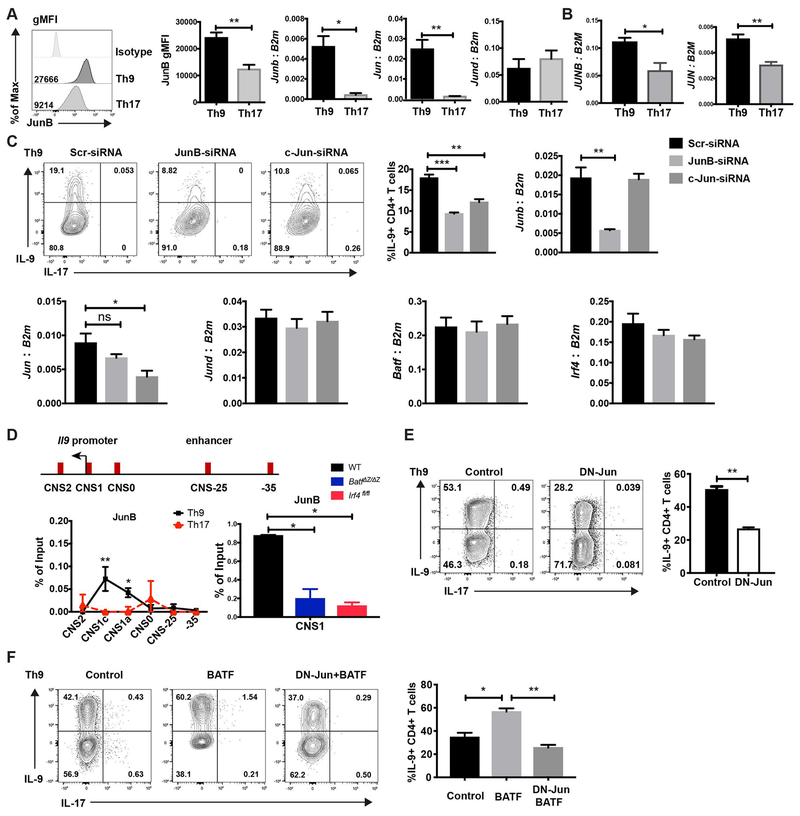
Fig. 2. JunB and c-Jun are required for IL-9 production in Th9 cells.
(A) Naive mouse CD4 T cells were cultured under Th9 and Th17 conditions. JunB expression was detected by intracellular staining. Jun family member expression was detected by qRT-PCR. RNA expression data was normalized to B2m expression. (B) Naïve human CD4 T cells were cultured under Th9 and Th17 conditions and Jun family member expression was detected by qRT-PCR. RNA expression data was normalized to B2M expression. (C) Naive CD4 T cells were cultured under Th9 condition, scrambled siRNA,JunB siRNA or c-Jun siRNA were transfected into the cells on day 1. Cells were collected for mRNA analysis after 48 hours transfection and cytokine production was detected on day 5 after PMA and ionomycin stimulation. Dot plots were gated on live CD4 cells. (D) Schematic of the Il9 locus indicating CNS elements (top). ChIP assay analysis of JunB at the CNS regions of the Il9 gene in WT, BatfΔZ/ΔZ and Irf4fl/fl Th9 and WT Th17 cells (bottom). A non-conserved sequence at −35kb was used as a negative control. Percent input depicted are the JunB ChIP values after subtraction of the control IgG ChIP values. (E) Day1 Th9 cells were transduced with MIEG control or DN-Jun expressing retrovirus on day 1 and cytokine production was detected on day 5 after PMA/ionomycin stimulation for 5 hours. Dot plots were gated on live CD4+ GFP+ cells. (F) Naive CD4 T cells were cultured under Th9 condition and transduced by control retrovirus, BATF expressing retrovirus, or both BATF and DN-Jun expressing retrovirus on day 1. Cytokine production was detected on day 5 after PMA and ionomycin stimulation. Dot plots were gated on live CD4 transduced cells. Data are mean ± SEM of 3 mice per experiment and representative of three independent experiments. A two tailed Student’s t-test was used for pairwise comparisons. One-way ANOVA with a post-hoc Tukey test was used to generate p-values for all multiple comparisons. *p<0.05, **p<0.01.

