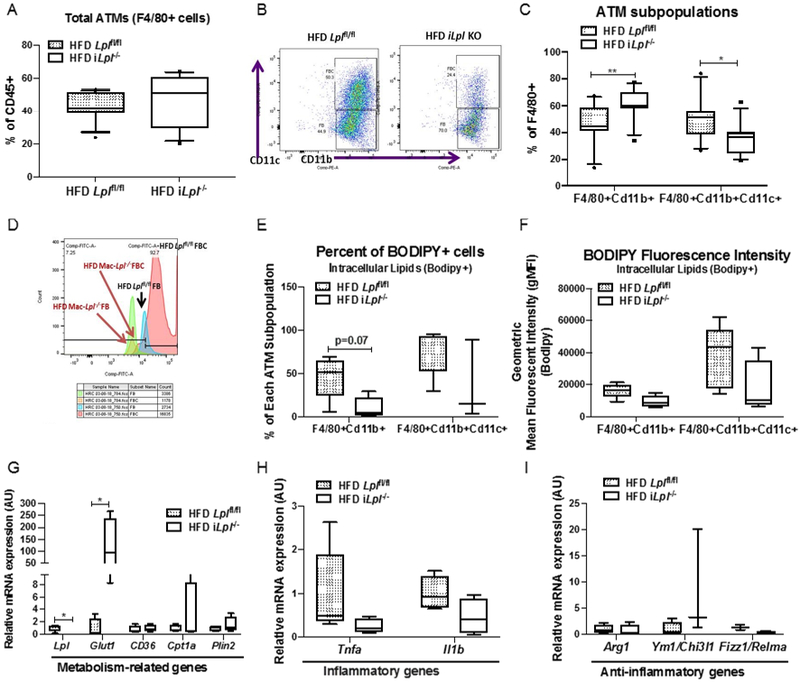
Figure 6. Inducible Lpl ablation decreases CD11c+ ATMs (FBCs) content, ATM lipid accumulation, but does not affect ATM polarity despite a dramatic increase in Glut1 expression.

HFD fed littermate controls (Lplfl/fl) and iLpl−/− (Lplfl/fl;β-actin-MerCreMer) mice were studied for total ATM (CD45+F4/80+) content, ATM subpopulation (CD45+F4/80+Cd11b+ and CD45+F4/80+CD11b+CD11c+), and ATM polarity. (A) Flow cytometry analysis of total ATMs (CD45+F4/80+). (B) Representative flow cytometry plots for ATM subpopulations; FBs (CD45+F4/80+Cd11b+) and FBCs (CD45+F4/80+CD11b+CD11c+) and quantified FBs and FBCs (N=11-17/group). (C) Quantified percentage of FBs and FBCs from CD45+F4/80+ cells. (D) Representative flow cytometry histogram plots are shown for BODIPY fluorescence in FBs and FBCs from HFD Lplfl/fl and HFD iLpl−/− mice (N=3-5/group). (E) Quantified percentage of BODIPY fluorescence in FBs and FBCs (N=3-5/group). (F) Quantification of BODIPY geometric mean fluorescence intensity (gMFI) in FBs and FBCs (N=3-5/group). (G) The expression of metabolism-related genes (Lpl, Glut1, Cd36, Cpt1a, Plin2) in ATMs (N=4-5/group). (H) The expression of inflammatory genes (Tnfa, Il1b) in ATMs (N=4-5/group). (I) The expression of anti-inflammatory genes (Arg1, Ym1, Fizz1) in ATMs (N=4-5/group). *p<0.05, **p<0.01. Results are represented as median with 25th and 75th percentiles, capped bars at 10th and 90th percentile and compared between Lplfl/fl and iLpl−/− using unpaired t-test (A-F, CD36, Tnfa, Il1b) or Mann-Whitney Test (LpL, Glut1, Cpt1a, Plin2).
