
Figure 7. HHcy promoted vascular wall inflammatory MC subsets and M1 MØ polarization inT2DM mice.
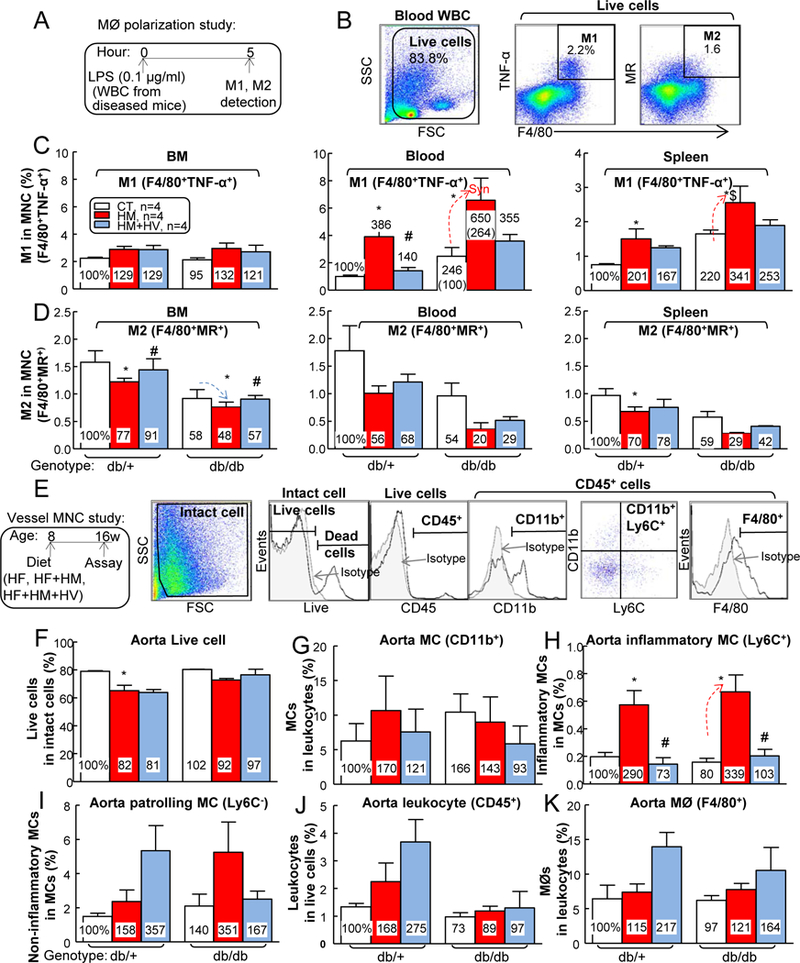
db/+ mice (non-T2DM groups) and db/db mice (T2DM groups) were fed a HF, HF+HM, or HF+HM+HV diet from 8 weeks old to 16 weeks old and euthanized. (A) Schematic illustration of MØ polarization: cells suspended from mouse BM, peripheral blood and spleen were incubated with LPS (0.1 μg/ml) for 5 hours, and then the cells were stained with monoclonal antibodies (mAbs) against F4/80 (MØ marker), TNF-α (proinflammatory M1 MØ marker), MR (or CD206, anti-inflammatory MØ marker), and assayed by flow cytometry. (B) Two cellular populations, M1 MØ (F4/80+TNFα+) and M2 MØ (F4/80+MR+), were analyzed separately. Quantitative analysis of M1 (C) and M2 (D) MØs in BM, peripheral blood and spleen are shown in bar graphs. Note that M1 MØs subsets were increased in HHcy+T2DM mice, while M2 MØs were decreased in HHcy+T2DM mice. Aorta single cell suspension were prepared, stained with live/dead dye, anti-CD45, -CD11b, -F4/80 and –Ly6C mAbs, and analyzed by flow cytometry. (E) Representative dot plots depicting different cell types: live, CD45+ (leukocytes), F4/80+ (macrophages), CD11b+ (MCs) and Ly6C+ (inflammatory MCs). Quantitative analysis of live cell (F), MC (G), inflammatory MC (H), patrolling MC (I), leukocyte (J) and MØ (K), in aorta are shown in bar graphs. Note that CD11b+Ly6C+ inflammatory MC subset was increased in aorta of HHcy+T2DM mice. N=4 mice. *P<0.05 vs HF diet mice with the same genotype, #P<0.05 vs HF+HM diet mice with the same genotype, $P<0.05 vs db/+ mice on the same diet. Synergy was defined as HHcy and T2DM produced a greater effects in HHcy+T2DM mice than the sum of that in HHcy and T2DM alone. WBC, white blood cell.