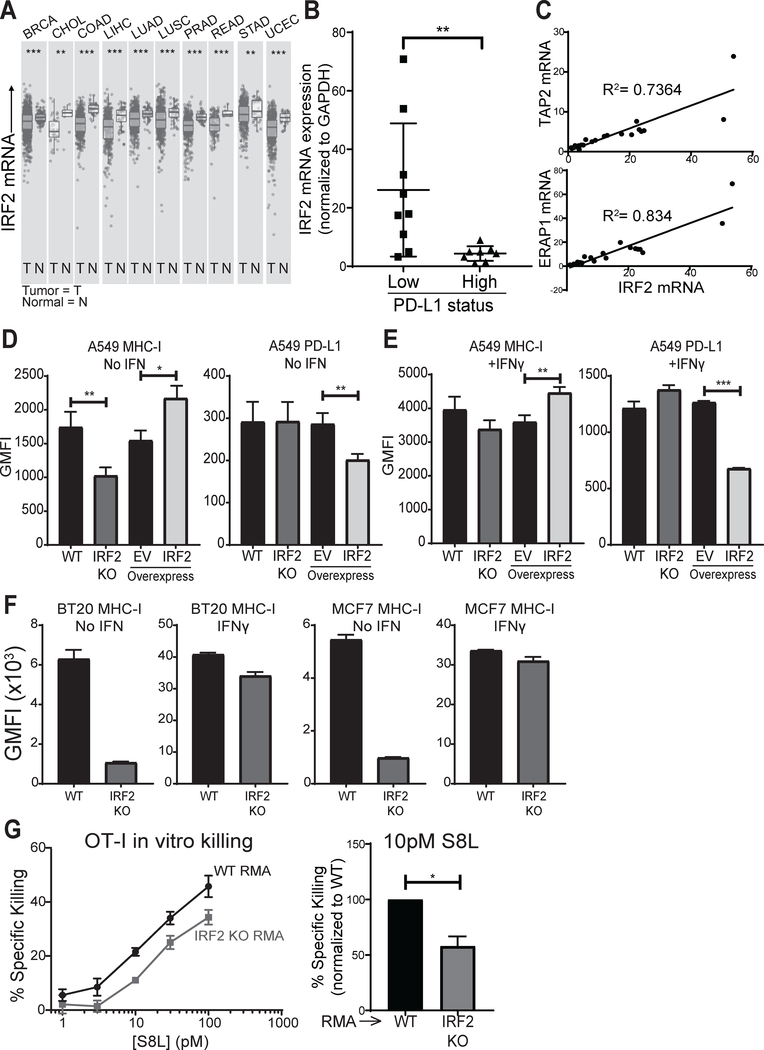
Figure 6. IRF2 and cancer.
(A) Differential IRF2 expression in tumor and normal tissue from patients with the indicated cancer types (TCGA abbreviations), as queried from TIMER (42); (B) IRF2 mRNA expression in patient NSCLC specimens scored as PD-L1 low (1–50%) or high (>50%) by immunohistochemistry. IRF2 mRNA expression was normalized to GAPDH mRNA expression in each lung specimen and then IRF2 expression across specimens was compared by calculating fold changes over the lowest IRF2-expressing specimen, which was set equal to 1. Mann-Whitney U test, **p<0.01; (C) TAP2 (top) and ERAP1 (bottom) mRNA correlations with IRF2 mRNA in NSCLC specimens. Linear regression models shown with R2 for goodness of fit; (D-E) Geometric MFI of surface MHC-I (left) and PD-L1 (right) on (D) unstimulated or (E) overnight IFNγ-stimulated A549 lines knocked out for IRF2 (“IRF2 KO”) or control (“WT”) or overexpressing IRF2 or empty vector (EV) as control. Bars represent mean + SEM (N=3). Two-tailed ratio paired t-tests, *p<0.05, **p<0.01, ***p<0.001; (F) Geometric MFI of surface MHC-I on unstimulated or IFNγ-stimulated human breast carcinoma (BT20 and MCF7) lines knocked out for IRF2 (“IRF2 KO”) or control (“WT”). Bars represent mean + SEM (N=3). Two-tailed ratio paired t-tests, **p<0.01, ***p<0.001; (G) Pre-activated OT-I effectors were cultured with pairs of wild-type (“WT RMA”) or IRF2 KO (“IRF2 KO RMA”) cells that were S8L-pulsed or not and labeled with different amounts of the dye CFSE. After 4 hours, specific killing was quantified by flow cytometry. (Left) % specific killing dose-titration curve for one representative experiment using an effector to target ratio of 1:2 and [S8L] indicated, points show mean ± SD of technical triplicates; (Right) % specific killing of IRF2 KO relative to that of WT RMA at 10pM S8L. Bars represent mean + SEM (N=4). Two-tailed ratio paired t-test, *p<0.05.s

