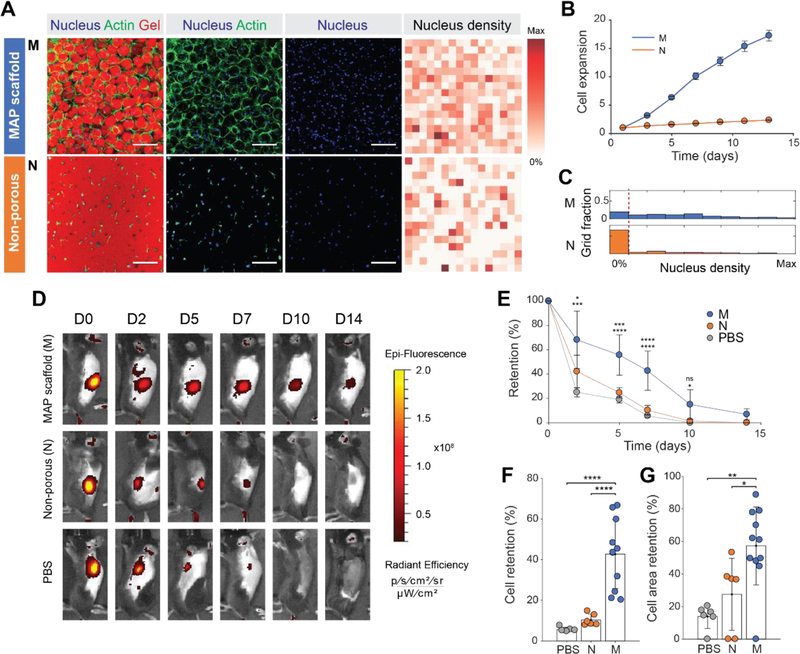
Figure 2. Controlled microporosity generated by MAP scaffolds facilitates the highest proliferation in vitro and retention in vivo.
(A) Fluorescent images of MSCs growing in MAP scaffolds (M), and non-porous scaffolds (N) following two weeks of in vitro culture. Corresponding heat map of nucleus density in the fields of view. Darker red color indicates a region with a higher number of nuclei. (Blue, nucleus; Green, actin; Red, gel). Scale bar: 200 µm. (B) Cell proliferation of fluorescently transfected MSCs measured by increase in fluorescence intensity over time (n = 4). (C) Histograms of nucleus density for five scaffold conditions (n = 4 scaffolds per condition). The red dashed line indicates the threshold for no nuclei in a region. (D) Representative fluorescence IVIS images of MSCs producing RFP that were subcutaneously injected into C57BL/6 mice with MAP scaffold (M), non-porous scaffold (N) and PBS at 0, 2, 5, 7, 10, and 14 days post-implantation. (E) Integrated fluorescent intensity at each time point (n = 6–11). (F) Comparison of cell retention at day 7 relative to day 0. (G) Comparison of cell area at day 7 relative to day 0. Cell area was defined as an area with radiant efficiency higher than 2×10⁷. Each point represents an individual mouse. All data are presented as average ± s.d. Statistical significance based on one-way ANOVA followed by Tukey’s HSD post hoc test (*p < 0.05, **p < 0.01, ***p < 0.001, ****p < 0.0001); n.s. indicates not significant.

