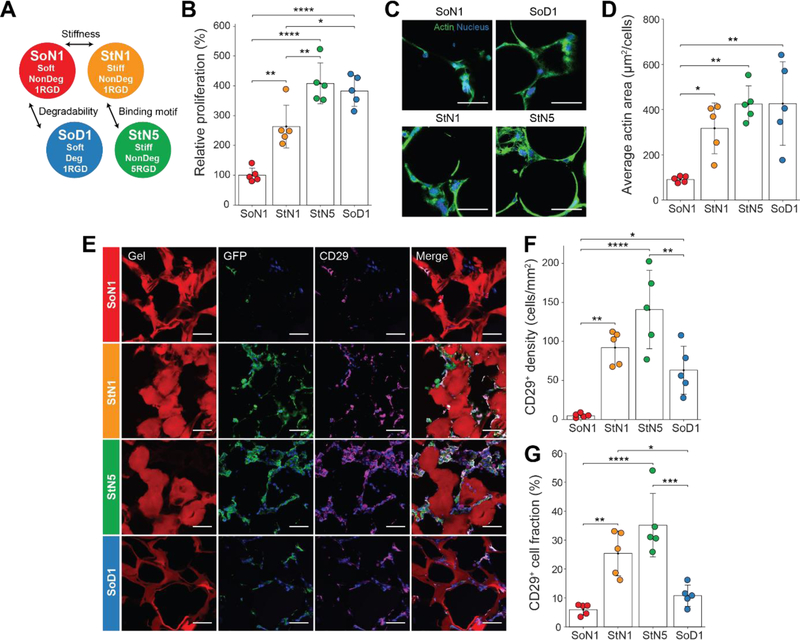
Figure 3. Modulating MAP scaffold material properties affect MSC function.
(A) Four MAP gel formulations manufactured to study the effect of degradability, stiffness and binding motif concentration. (B) Relative cell expansion in vitro at 7 days (n = 5). (C) Representative fluorescent images of MSC growth in vitro following two weeks (Blue, nucleus; Green, actin). Scale bar: 50 µm. (D) Average actin area normalized by the number of cells for in vitro culture (n = 5). (E) Representative fluorescent images of GFP-producing MSCs in MAP scaffolds subcutaneously injected into C57BL/6 mice following two weeks (Red, gel; Blue, nucleus; Green, GFP; Magenta, CD29). Scale bar: 50 µm. (F) CD29+ cells per area in scaffolds at week 2 (n = 5). (G) Ratio of CD29+ cells to all cells in the scaffolds at week 2 (n = 5). Each dot in the plots represents an individual mouse. All data are presented as average ± s.d. Statistical significance based on one-way ANOVA followed by Tukey’s HSD post hoc test (*p < 0.05, **p < 0.01, ***p < 0.001, ****p < 0.0001).

