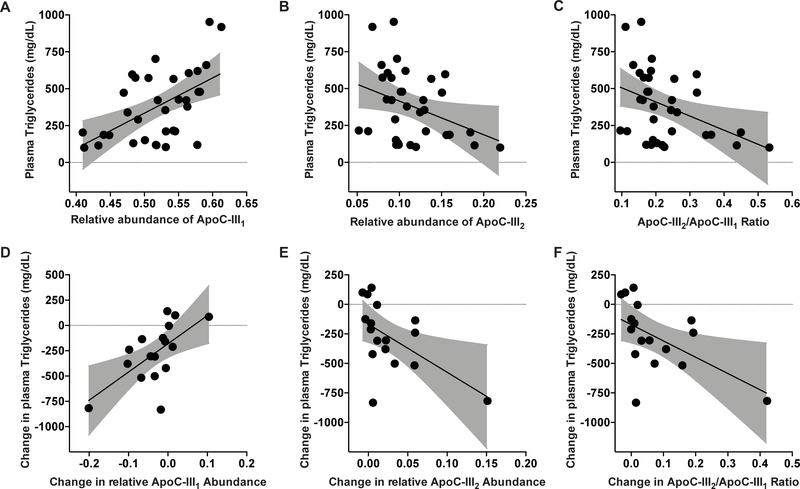
Figure 5: Association of apoC-III glycoforms with TG levels before and after volanesorsen treatment.
(A) The relative abundance of apoC-III1 was significantly correlated with TG levels (r= 0.54, p = 0.0009). (B) In contrast, the relative abundance of apoC-III2 was inversely associated with TG levels (r = −0.36, p = 0.03). (C) The ratio of apoC-III2/apoC-III1 was inversely associated with TG levels (r = −0.41, p = 0.016). At 85 days after treatment, (D) change in relative abundance of apoC-III1 was strongly correlated with change in TG levels (r = 0.63, p = 0.006). (E) Change in relative abundance of apoC-III2 was inversely correlated with change in TG levels (r = −0.55, p = 0.02). (F) Change in apoC-III2/apoC-III1 ratio was inversely associated with change in TG levels (r = −0.54, p = 0.02).

