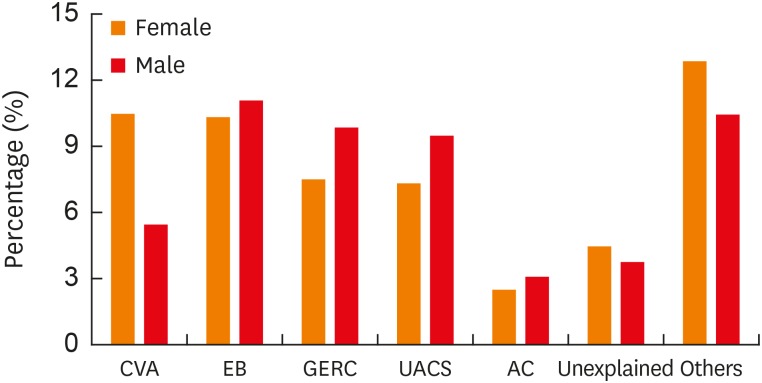
Fig. 4. Sex distribution of different causes of chronic cough. Percentage (%): ratios of the number of females or males to the total cough patients (n = 1,822).
CVA, cough-variant asthma; EB, eosinophilic bronchitis; GERC, gastro-esophageal reflux related cough; UACS, upper airway cough syndrome; AC, atopic cough.

