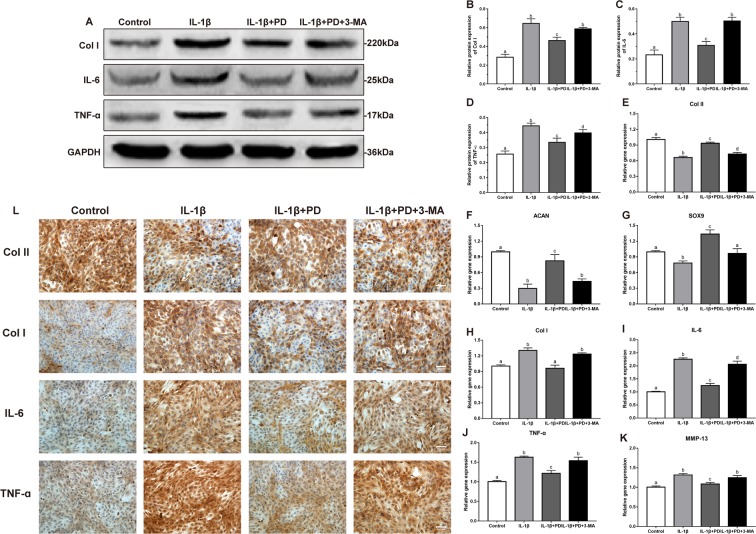
Figure 3.
PD restores chondrocyte function in vitro. (A–D) Western blot of Col I, IL-6, and TNF-α in different groups were detected respectively and the semi-quantitative analysis of Col I/GAPDH, IL-6/GAPDH, and TNF-α/GAPDH are shown. (E–K) qRT-PCR was performed to determine the expression levels of (E–H) Col I, Col II, SOX9 and ACAN and (I–K) osteoarthritis relative gene (IL-6, TNF-α and MMP-13). Values are the means ± SD, n = 5. Bars with different letters are significantly different from each other at p < 0.05 and those with the same letter exhibit no significant difference. (L) Immunohistochemical staining images revealed the presence of Col I, Col II, IL-6, and TNF-α. Original magnification × 200 (scale bar, 300 μm).

