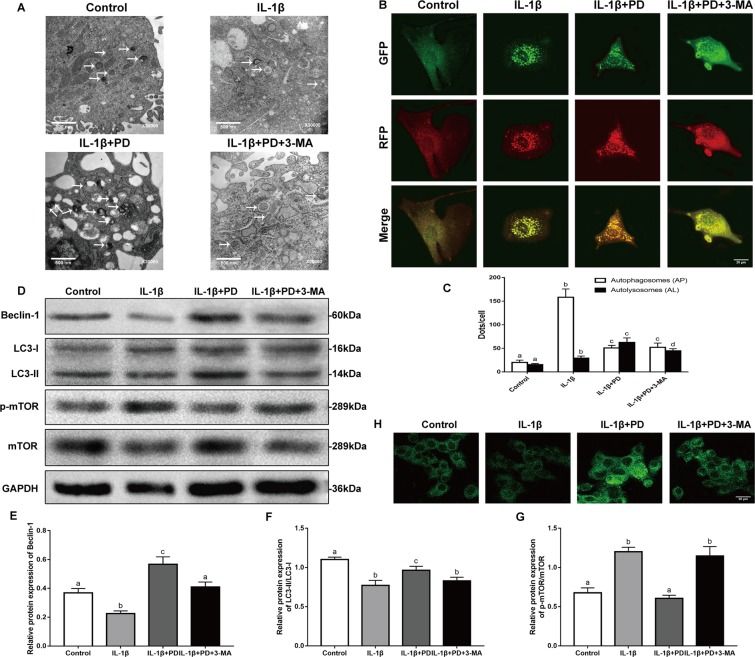
Figure 5.
Effects of PD on autophagic flux in cultured chondrocytes in vitro. (A) TEM images of the autophaghic change in chondrocytes. Single arrow: autophagolysosome and autophagosome with double membrane structure. Original magnification × 30000 (scale bar, 500 nm). (B) Cells transfected with adenovirus harbouring tandem fluorescent mRFP-GFP-LC3 for 24 h were subjected to different treatments. Representative pictures of immunofluorescent chondrocytes expressing mRFP-GFP-LC3. GFP dots are green, and mRFP dots are red. Original magnification × 1600 (scale bar, 20 μm). (C) Semi-quantitative analysis of autophagosomes (AP; yellow dots in merged images) and autolysosomes (AL; red only dots in merged images). (D) Western blot of LC3, Beclin1, and mTOR in different groups were detected respectively and the semi-quantitative analysis of LC3 II/I ratio, Beclin1/GAPDH, and mTOR/GAPDH are shown. (H) Representative pictures of MDC staining. Original magnification × 1600 (scale bar, 20 μm). Values are the means ± SD (n = 5). Bars with different letters are significantly different from each other at p < 0.05 and those with the same letter exhibit no significant difference.

