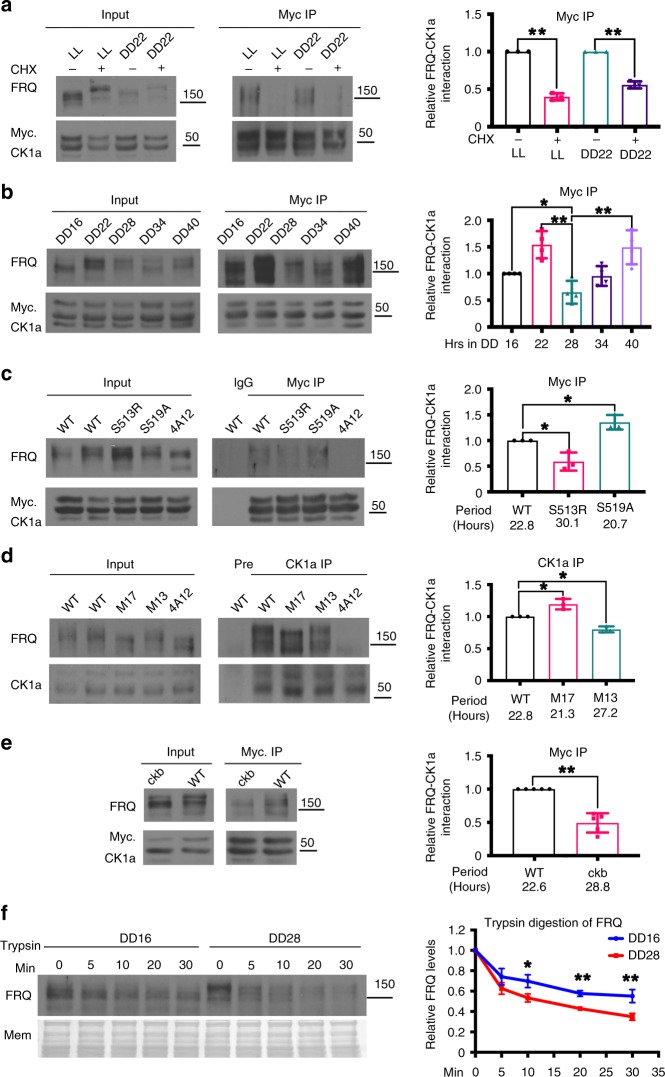
Fig. 3.
Regulation of the FRQ-CK1a interaction by FRQ phosphorylation. a c-Myc immunoprecipitation assay in the wild-type strain with and without CHX treatment. The cultures were grown in LL or DD and were treated with CHX for 1 h before immunoprecipitation was performed. Quantification of relative FRQ-CK1a interaction levels is based on the ratio of IP to Input. The densitometric analysis is shown on the right. Error bars are standard deviations (n = 3). **P < 0.01. Student’s t-test was used. The position of the molecular weight marker is indicated. b c-Myc immunoprecipitation assay in the wild-type strain at indicated time points in DD. The densitometric analysis is shown on the right. Error bars are standard deviations (n = 4). *P < 0.05, **P < 0.01. Student’s t-test was used. c, d c-Myc (c) or CK1a (d) immunoprecipitation assays showing the relative FRQ-CK1a interaction in the indicated FRQ phosphorylation sites mutants in LL. Long period mutants (S513R, M13) showed reduced FRQ-CK1a interaction while the interaction was increased in the short period mutants (S519A and M17). (n = 3). *P < 0.05. Student’s t-test was used. e c-Myc immunoprecipitation assays showing the relative FRQ-CK1a interaction is decreased in the long period ckbRIP mutant in LL. (n = 5). **P < 0.01. Student’s t-test was used. f Western blot showing trypsin digestion of hypophosphorylated (DD16) and hyperphosphorylated (DD28) FRQ. Densitometric quantification of full-length FRQ relative to the amount at time 0 is shown on the right. Error bars are standard deviations (n = 4). *P < 0.05, **P < 0.01. Student’s t-test was used. Source data are provided as a Source Data file

