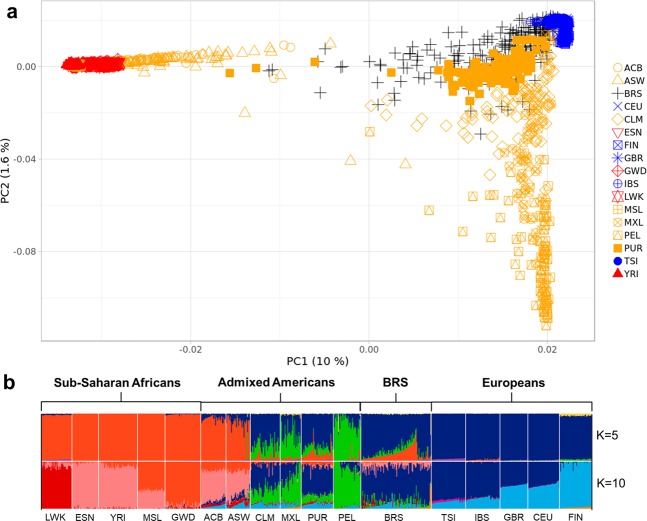
Figure 1.
(a) The figure depicts a scatterplot showing the two first principal components for the BRS sample (black), Europeans (blue), sub-Saharan Africans (red), and admixed Americans (orange) from 1 KGP. (b) Global ancestry inference for ADMIXTURE K = 5 and K = 10, including the BRS and Europeans, sub-Saharan Africans and admixed Americans, where K = 10 had the lowest CV error estimate. Grades of blue, grades of red, and green indicate European, sub-Saharan African, and native American ancestry components, respectively.

