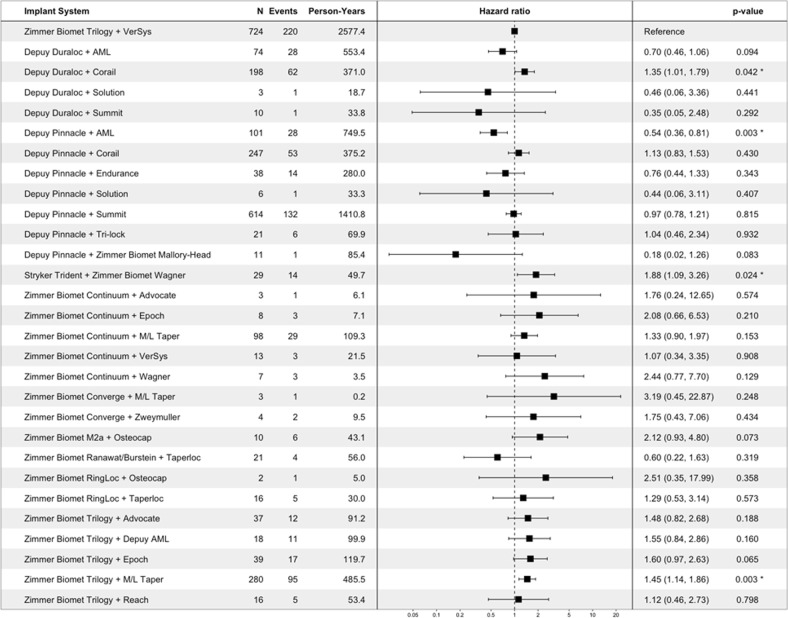
Fig. 4.
Summary of Cox proportional hazards analysis of the risk of any complication for each hip implant system. The table on the left lists the number of patients implanted with each system, the number of complication events observed for each, and the total person-years of data available. The forest plot displays the corresponding hazard ratio, with the hazard ratio (95% confidence interval) and p-value listed in the table to the right. Note that this figure only shows implant systems for which one complication event was observed

