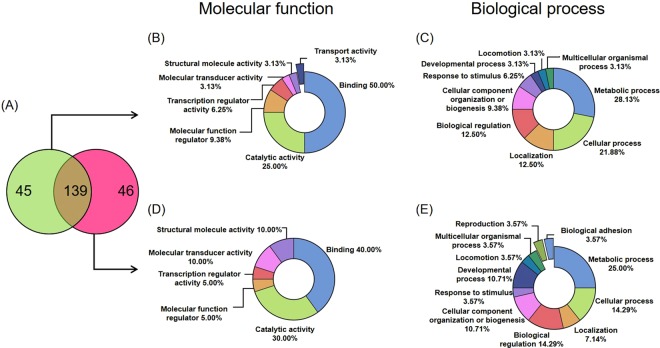
Figure 2.
Proteomic analysis reveals that protein content differ between plasma exosomes from transition cows at low-risk (LR-EXO) and high-risk (EXO) for metabolic dysfunction. (A) Venn diagram representing unique bovine proteins identifed in LR-EXO (green) or HR-EXO (pink) and common proteins (shaded). Panther analysis revealed differences in bovine proteins from circulating exosomes isolated from LR-EXO cows (B,C) and HR-EXO (D,E) in gene ontology (GO) classifications.

