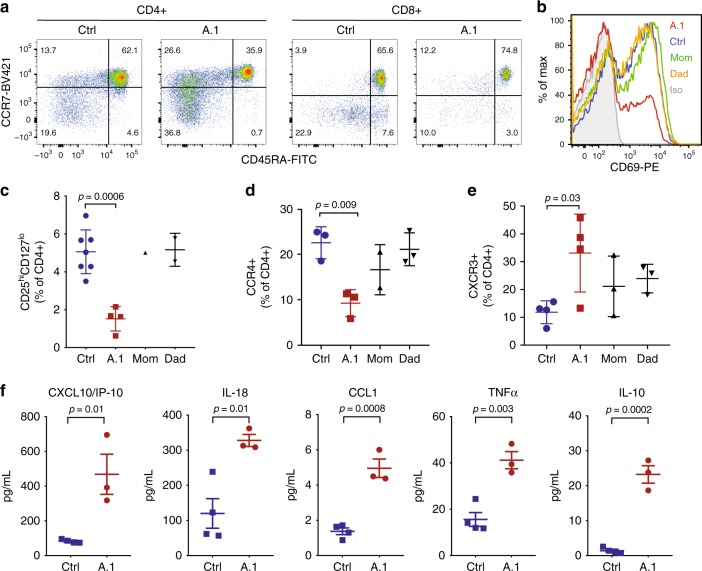
Fig. 2.
T cell abnormalities and elevated inflammatory serum cytokines/chemokines. a Flow cytometry of T cells from an unrelated healthy control or patient A.1 with staining for CD4, CD8, CD45RA, and CCR7, as indicated. b CD69 expression on CD8 + T cells from peripheral blood of the indicated subjects after 24 h of stimulation in vitro with anti-CD3 and anti-CD28 antibodies. c Frequency of CD25hiCD127lo among CD4 + peripheral blood T cells in unrelated healthy controls (n = 7), patient A.1 (n = 4), mom (n = 1), and dad (n = 2). Data from four independent experiments is presented as mean ± SD. Statistical analysis was performed using one-way ANOVA with Dunnett’s multiple comparisons test. d Frequency of CCR4 + among CD4 + peripheral blood T cells in unrelated healthy controls (n = 3), patient A.1 (n = 3), mom (n = 2), and dad (n = 3). Data from four independent experiments are presented as mean ± SD. Statistical analysis was performed using one-way ANOVA with Dunnett’s multiple comparisons test. e Frequency of CXCR3 + among CD4 + peripheral blood T cells in unrelated healthy controls (n = 4), patient A.1 (n = 4), mom (n = 3), and dad (n = 3). Data from four independent experiments are presented as mean ± SD. Statistical analysis was performed using one-way ANOVA with Dunnett’s multiple comparisons test. f Concentrations of the indicated cytokine or chemokine in serum from independent blood draws of unrelated healthy controls (n = 4) and patient A.1 (n = 3). Data from three independent experiments are presented as mean ± SEM. Statistical analysis was performed using two-tailed unpaired T-test

